Clinical Trials Experience.
The project was broken into three parts - Concepting a Future State, Building a Visual Design System and designing a Ready to Build first Release.
Currently users that process clinical trial data for pharmaceutical companies are using Excel spreadsheets to track drug data, trying to format pdfs to submit to the FDA. It’s a siloed and disjointed process that has teams duplicating work and structuring their clinical trial data incorrectly, which leads to longer trial times and FDA rejecting trial data.
Role: Senior Visual Designer
Project Length: 4 months, 2021
Team: Creative Director, 2 UXers, 5 BAs
Project Type: Future State Vision, Ready to Build Portal, Design System
PART ONE
2025 Future Vision.
Envisioning and concepting future ideas and features. Leveraging technologies like machine learning and deep learning.
-
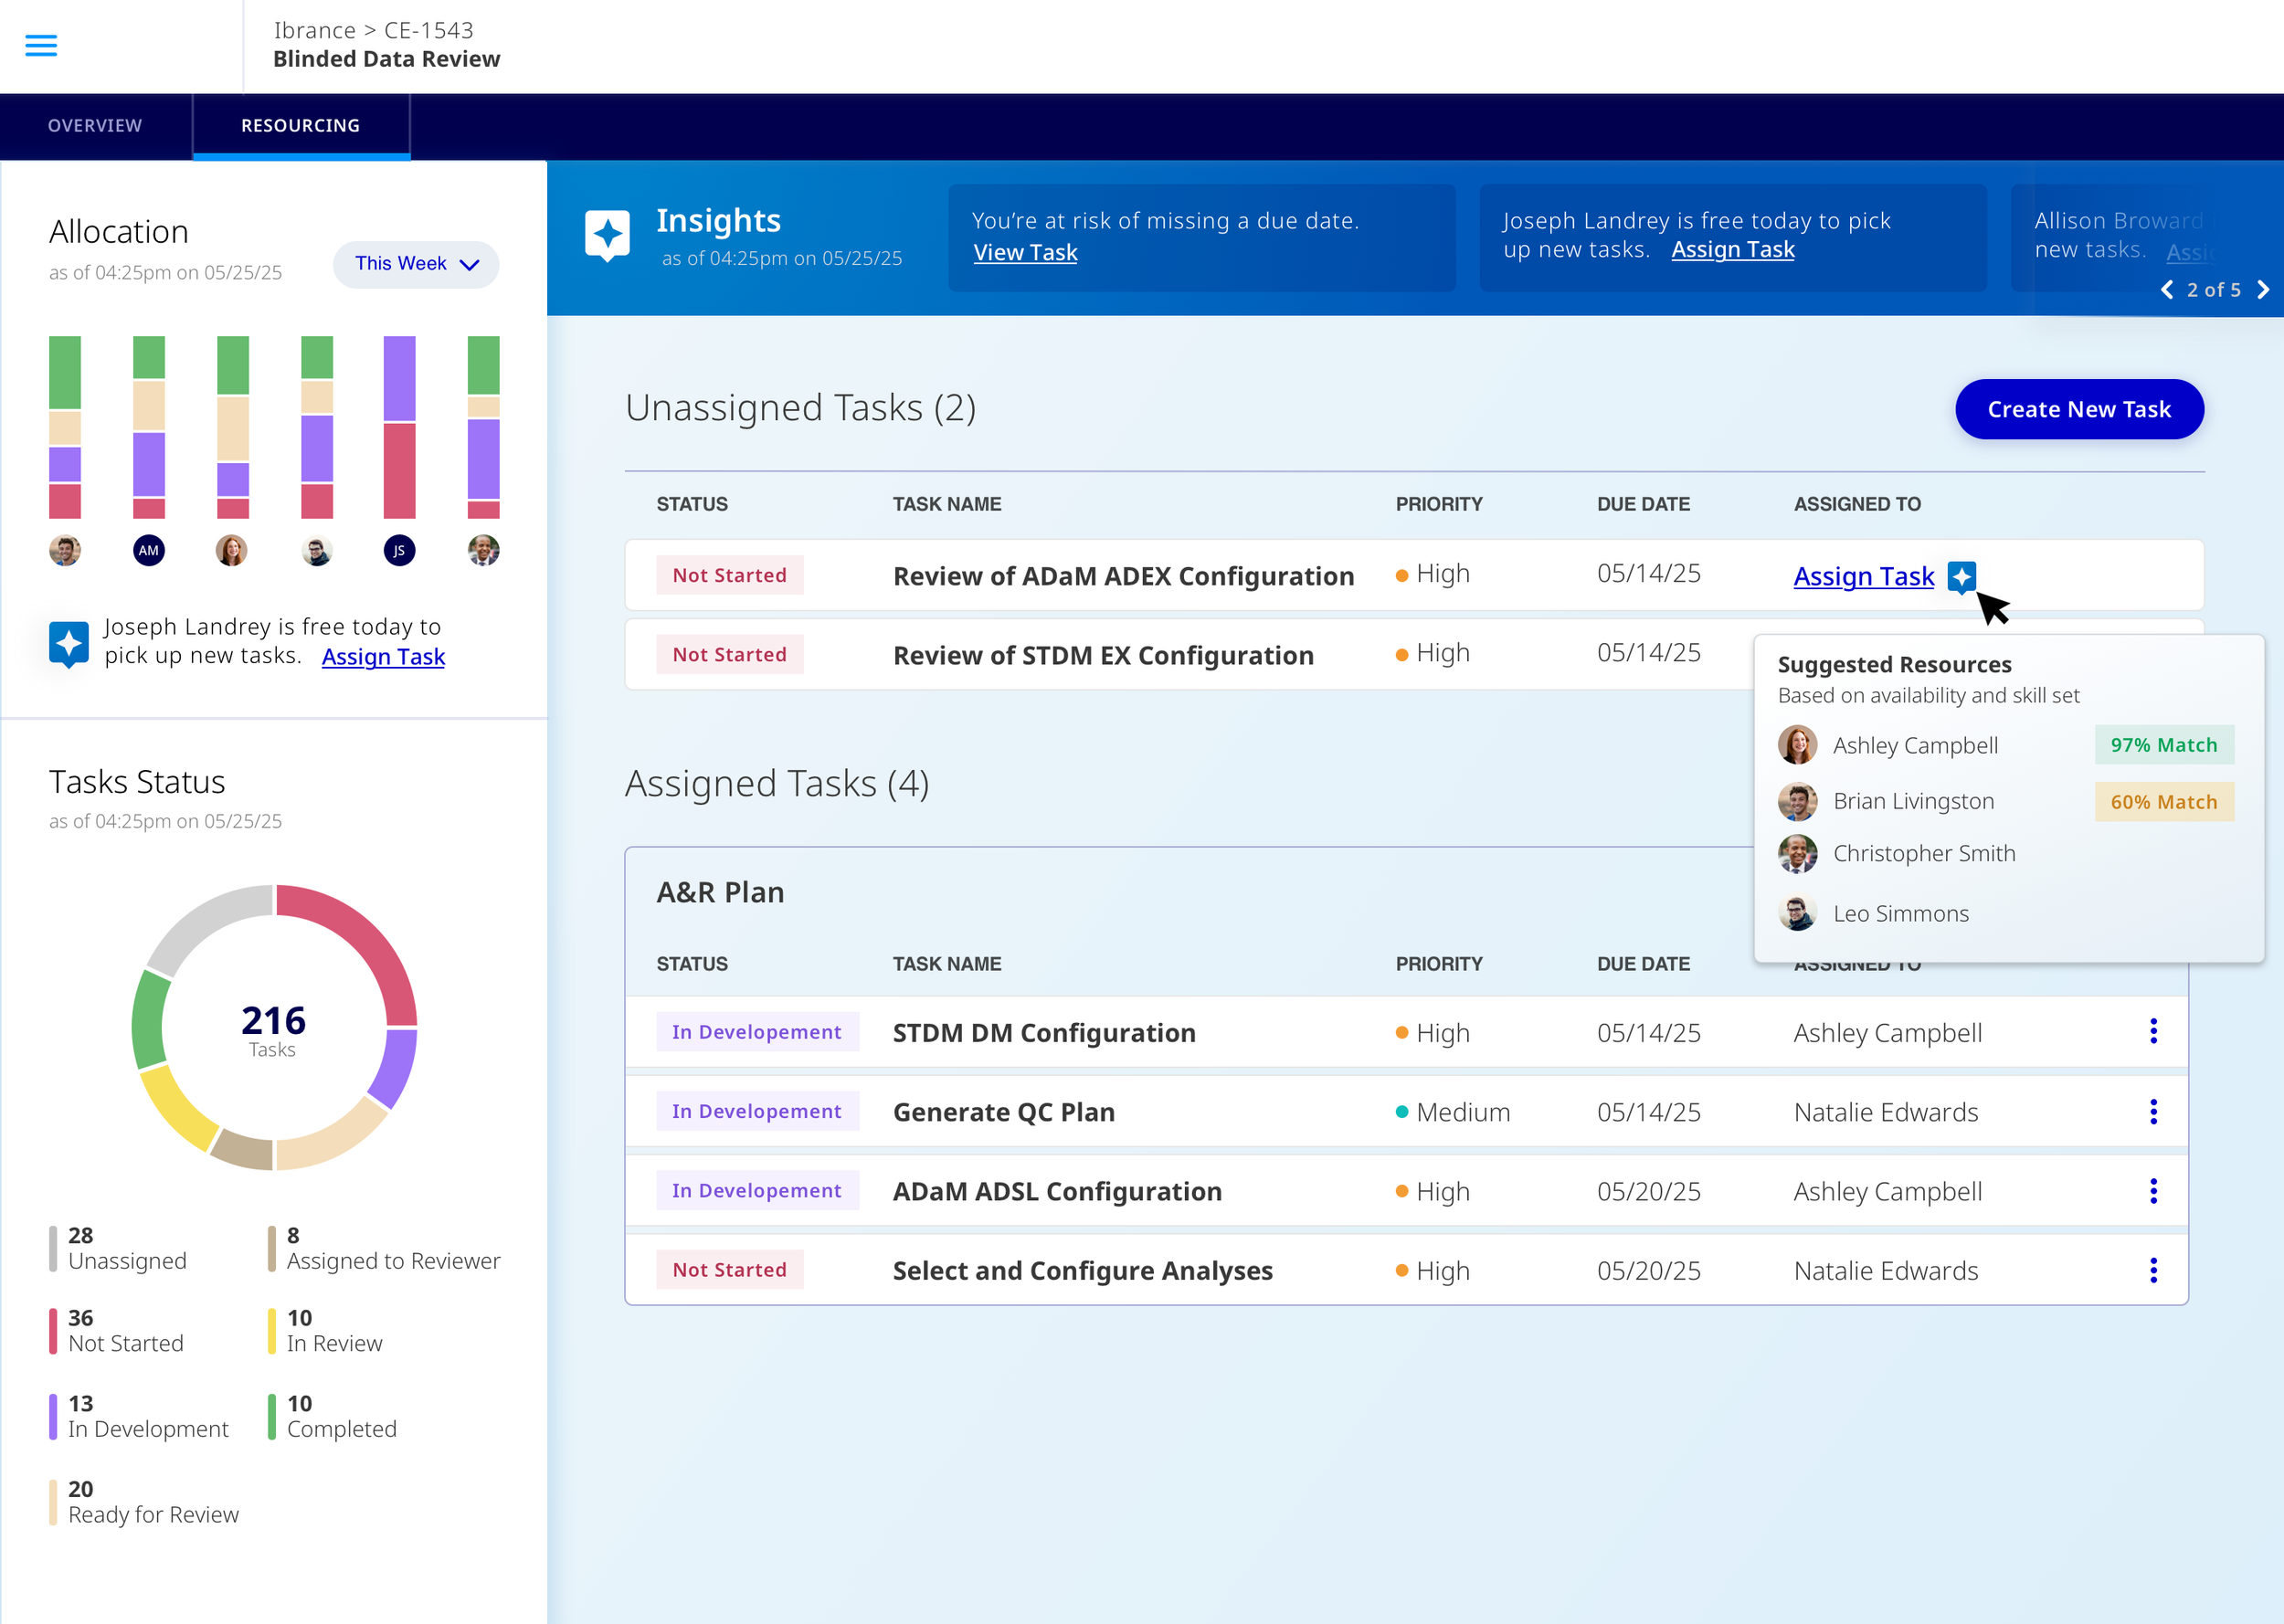
Automate & Suggest Resources.
When a task needs to be assigned to a team member, managers would get automated suggestions based on employees including skill set and availability.

-
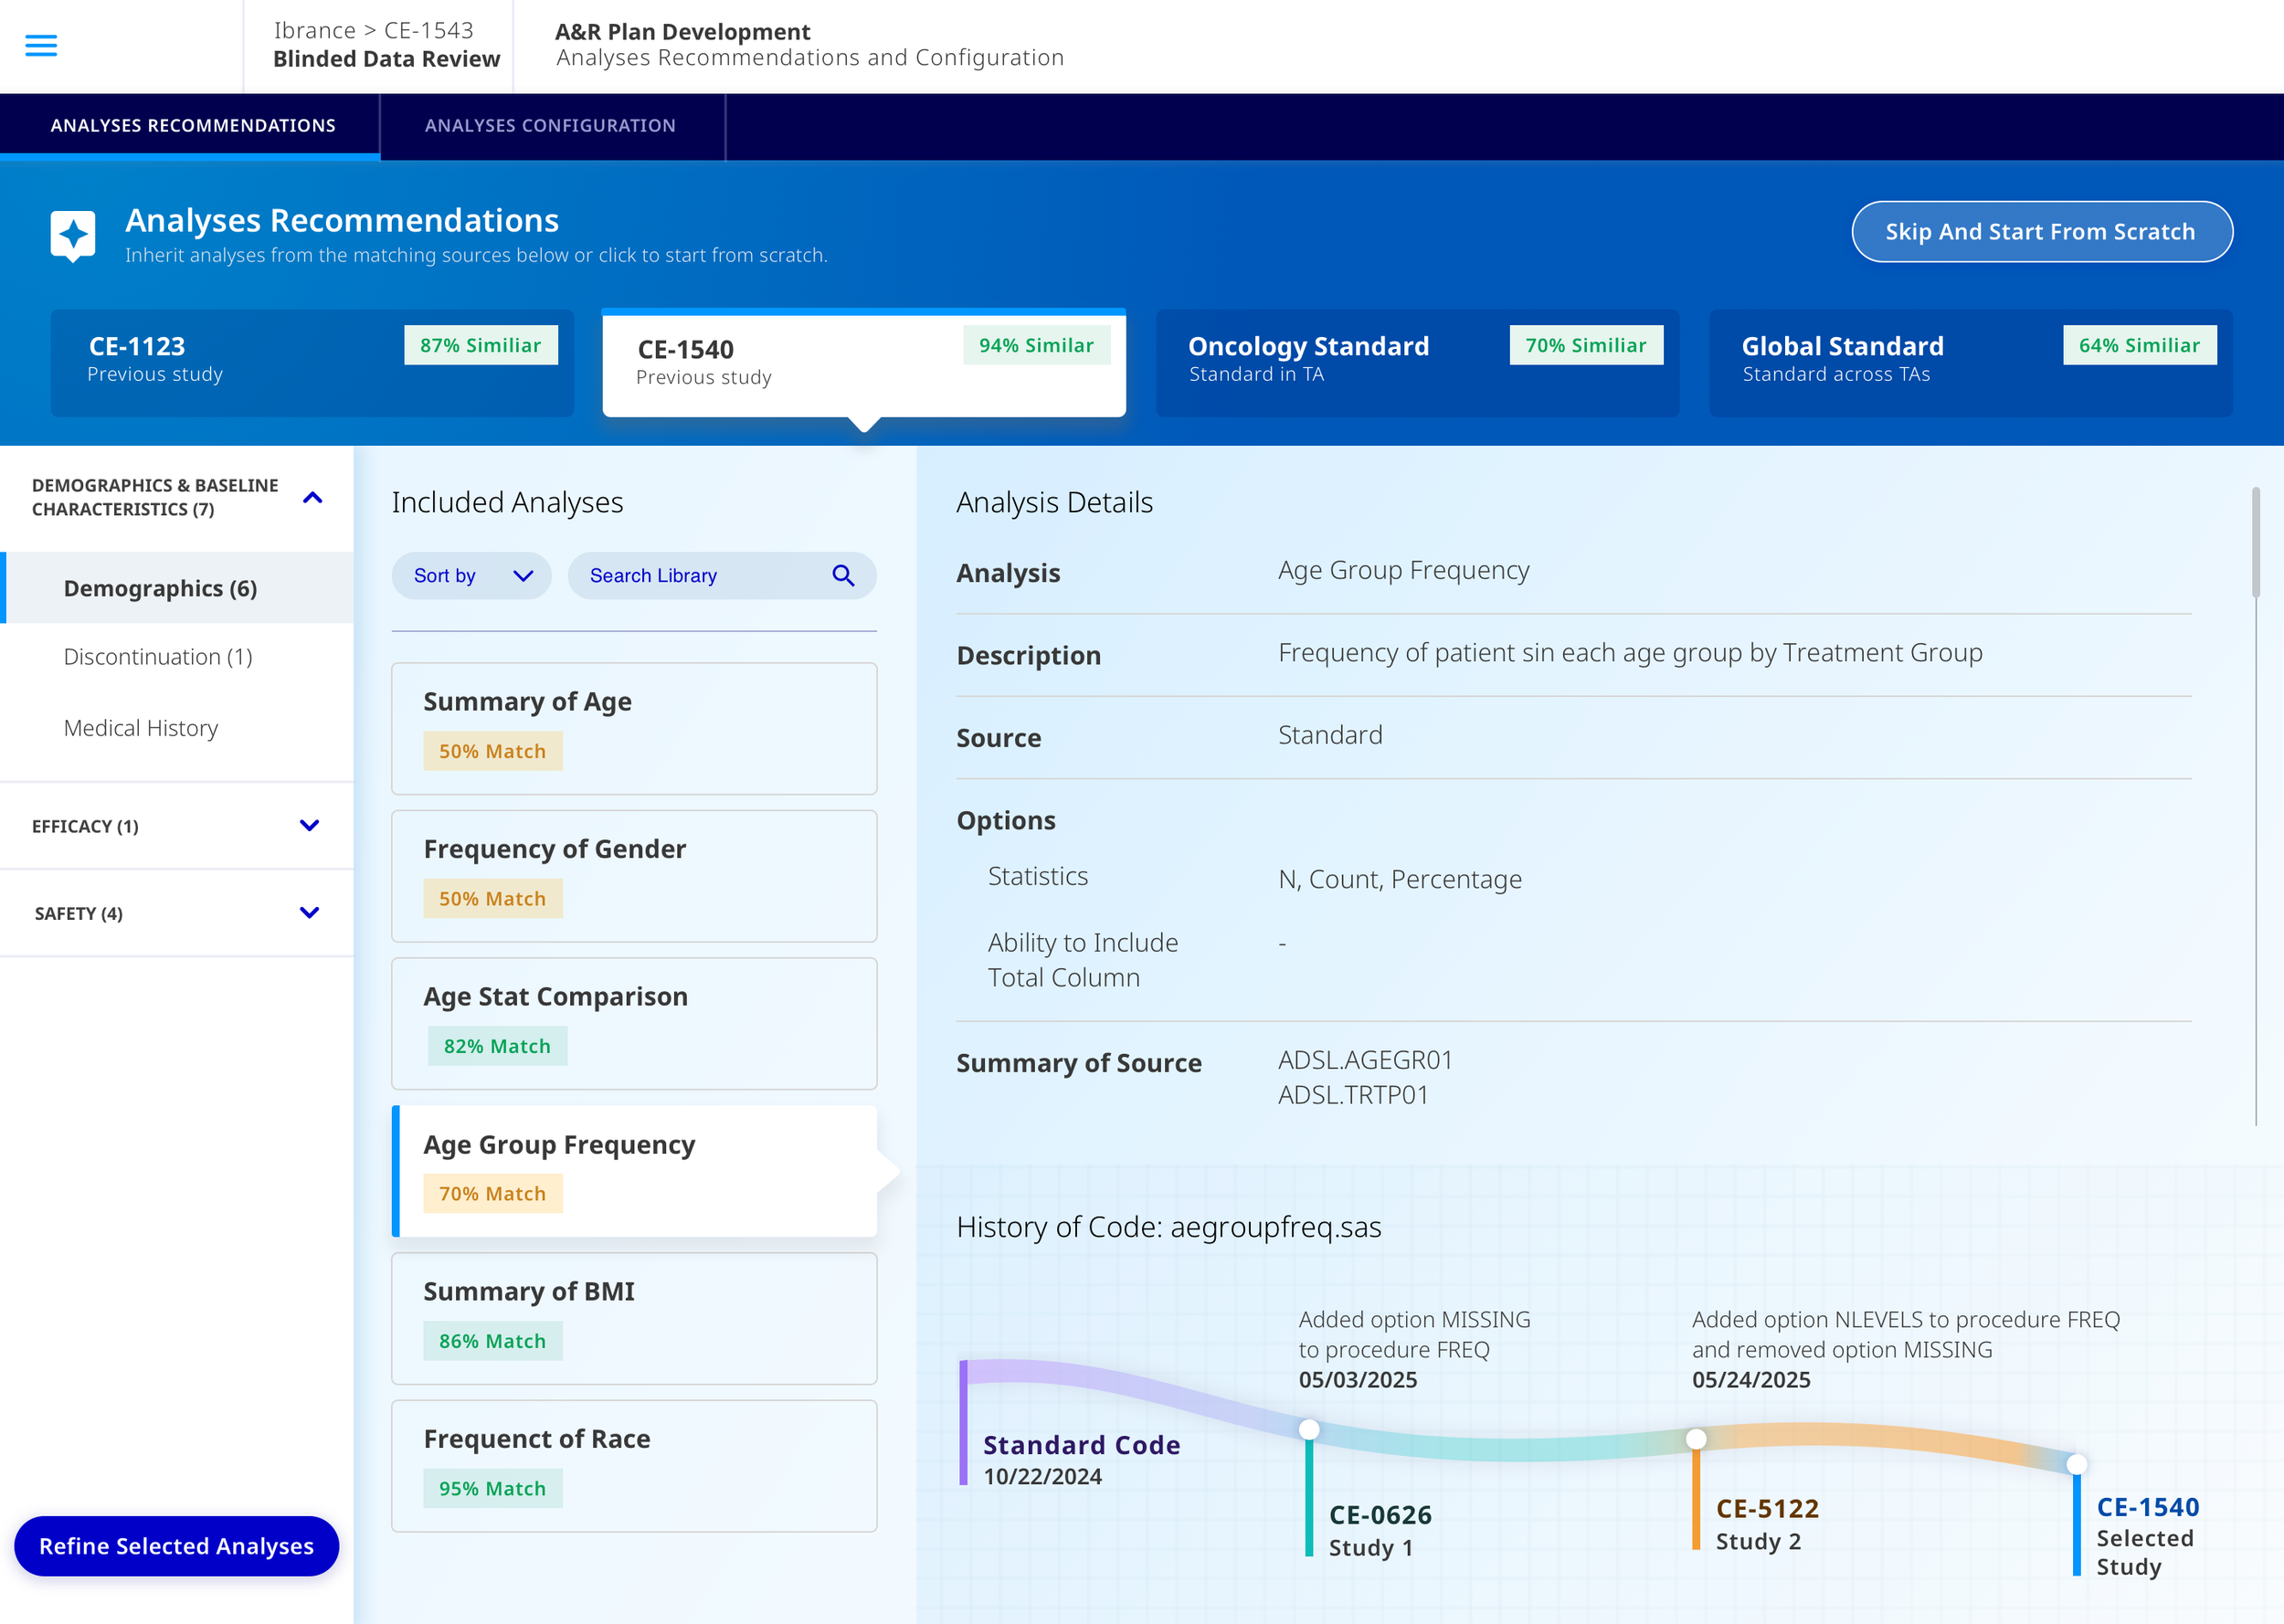
Tracking Study Lifecycles.
As studys evolve, users want to see all the different sources and data that have been added to the study, who has touched it or editted the study’s material.

-
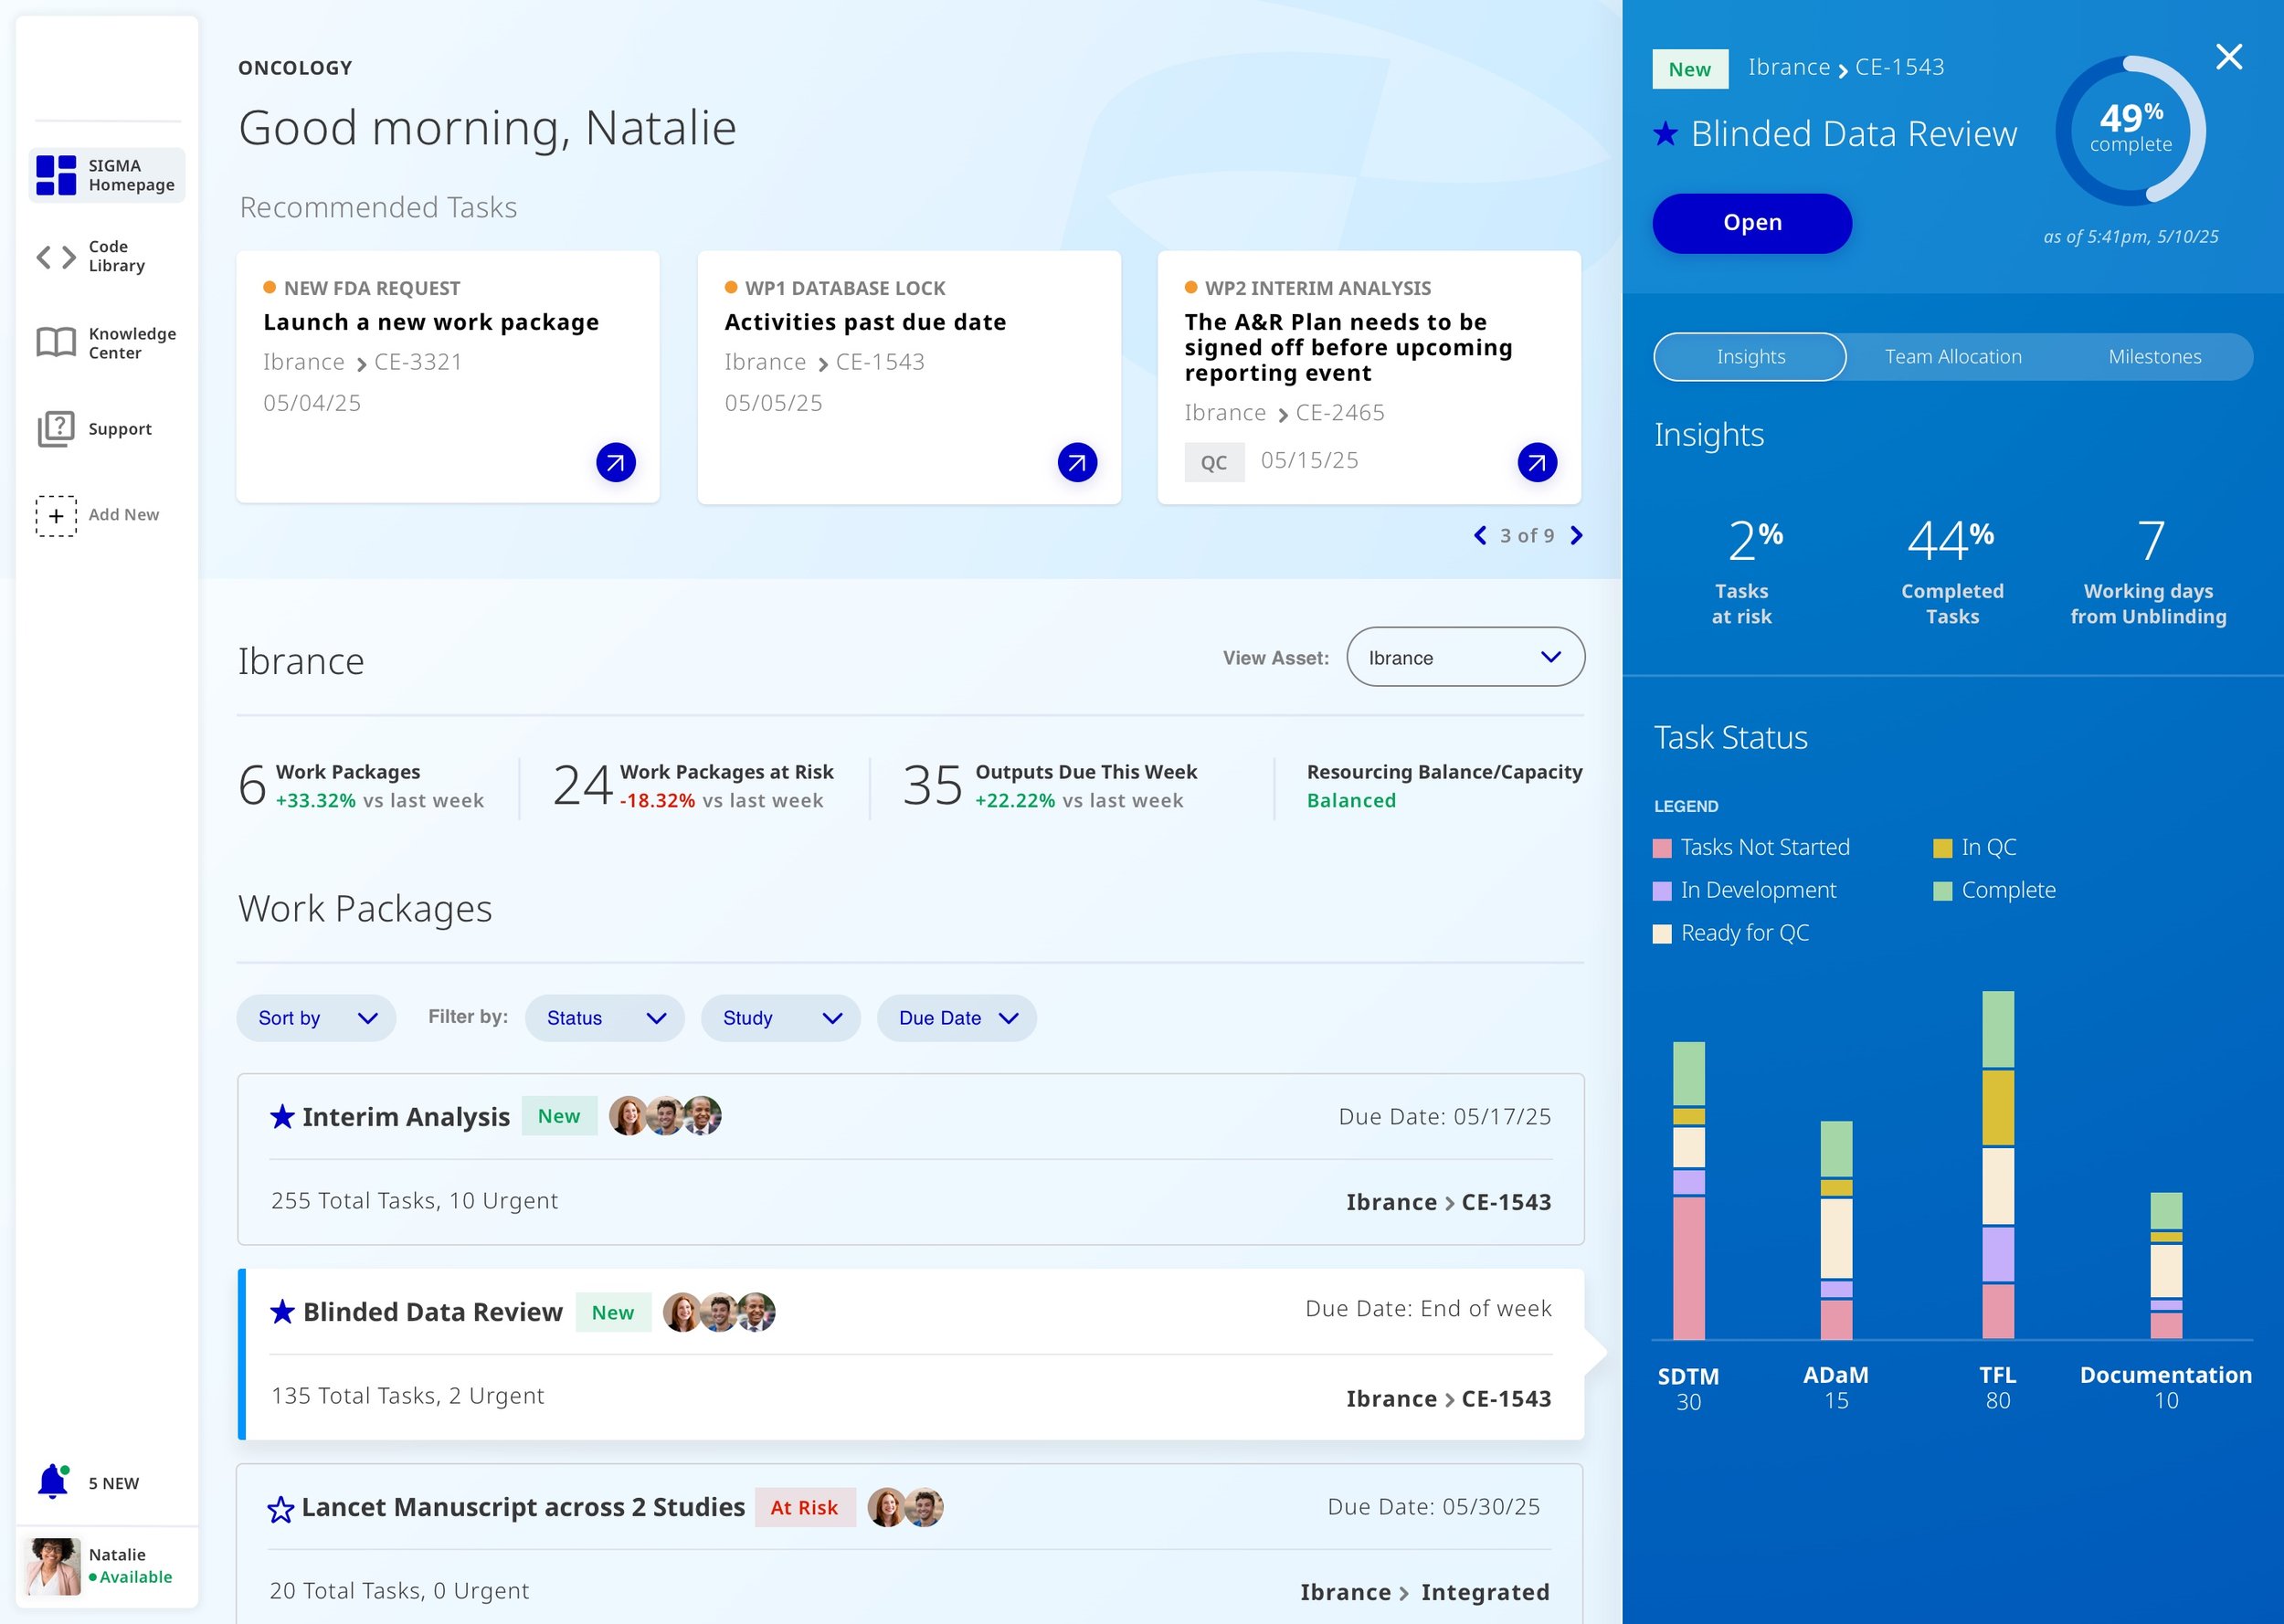
Tasks at a Glance.
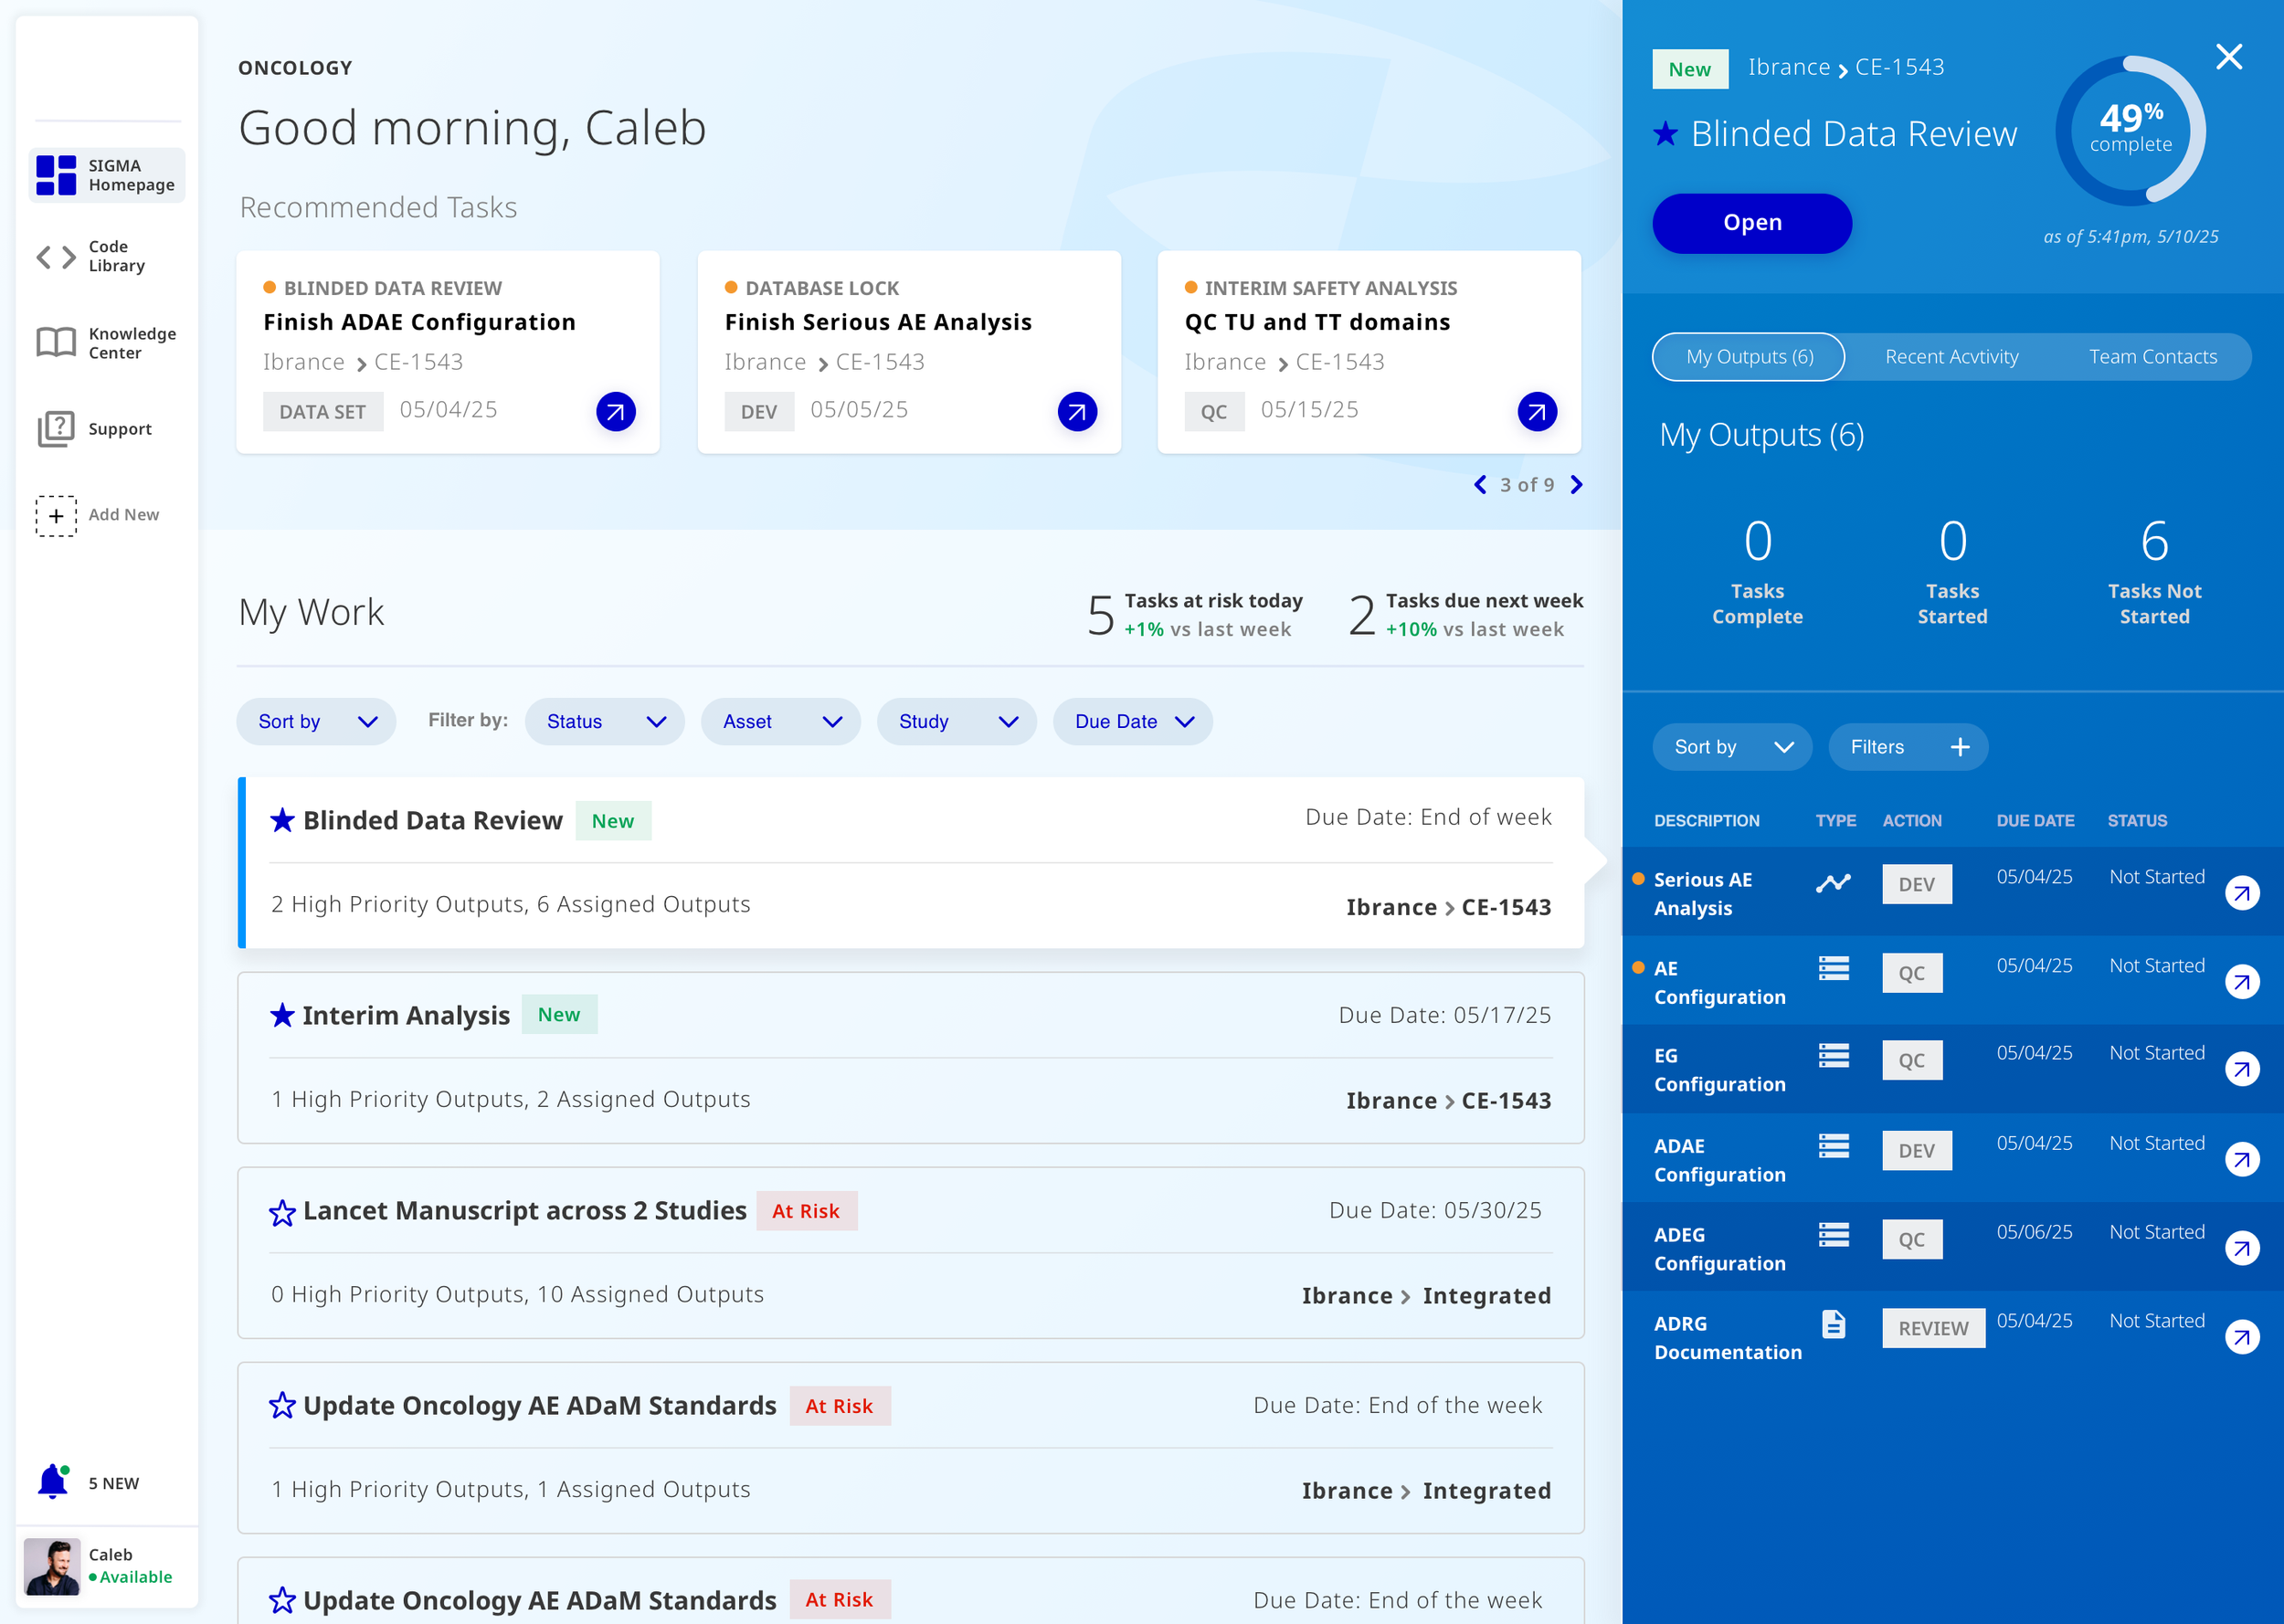
Directing users to where they should start their day and breaking up these massive studies into bite size pieces.

Full Comps.
PART TWO
Clinical Trials Portal
Release 1.
For R1, we designed:
1. A Home that displayed a user’s “Work Containers” - essentially these are their Clinical Studies and Trials.
2. A Workspace where users can create data structures to record and maintain Clinical Trial Data.
The biggest pain point to tackle in R1..
Designing a central place for users to create Clinical Trial Data Structures.
Currently, users are creating table structures in Excel and storing them locally. If coworkers would like to share structures, they email them to each other. Currently, there is no '“starting structure” for new users or if a user is new to a drug/clinical trial. There are 100s of copies of Excel files and no guidance of how to start or maintain a data structure.
Drag & Drop.
Users can build a data structure by dragging and dropping common data points for clinical trials. Users can reorganize, nest data points in either rows or columns, bold type, or change font sizes.
Edit Rows & Columns.
User can hide and show rows, further change data points and type within cells.
Preview PDF & Export.
The final output and purpose of creating a data structure is to 1. Easily fill clinical data once the trial is completed and 2. Send a PDF of that data to the FDA.
Using the toggle at the top of the page, the user can easily build the structure and then toggle to easily preview how the structure will look in a PDF (with page breaks and footnotes).
If all looks good, the user can publish to a hub for other users to access or export (either into the tool or locally) in order to package and send to the FDA.
PART THREE
Design System
Release 1.
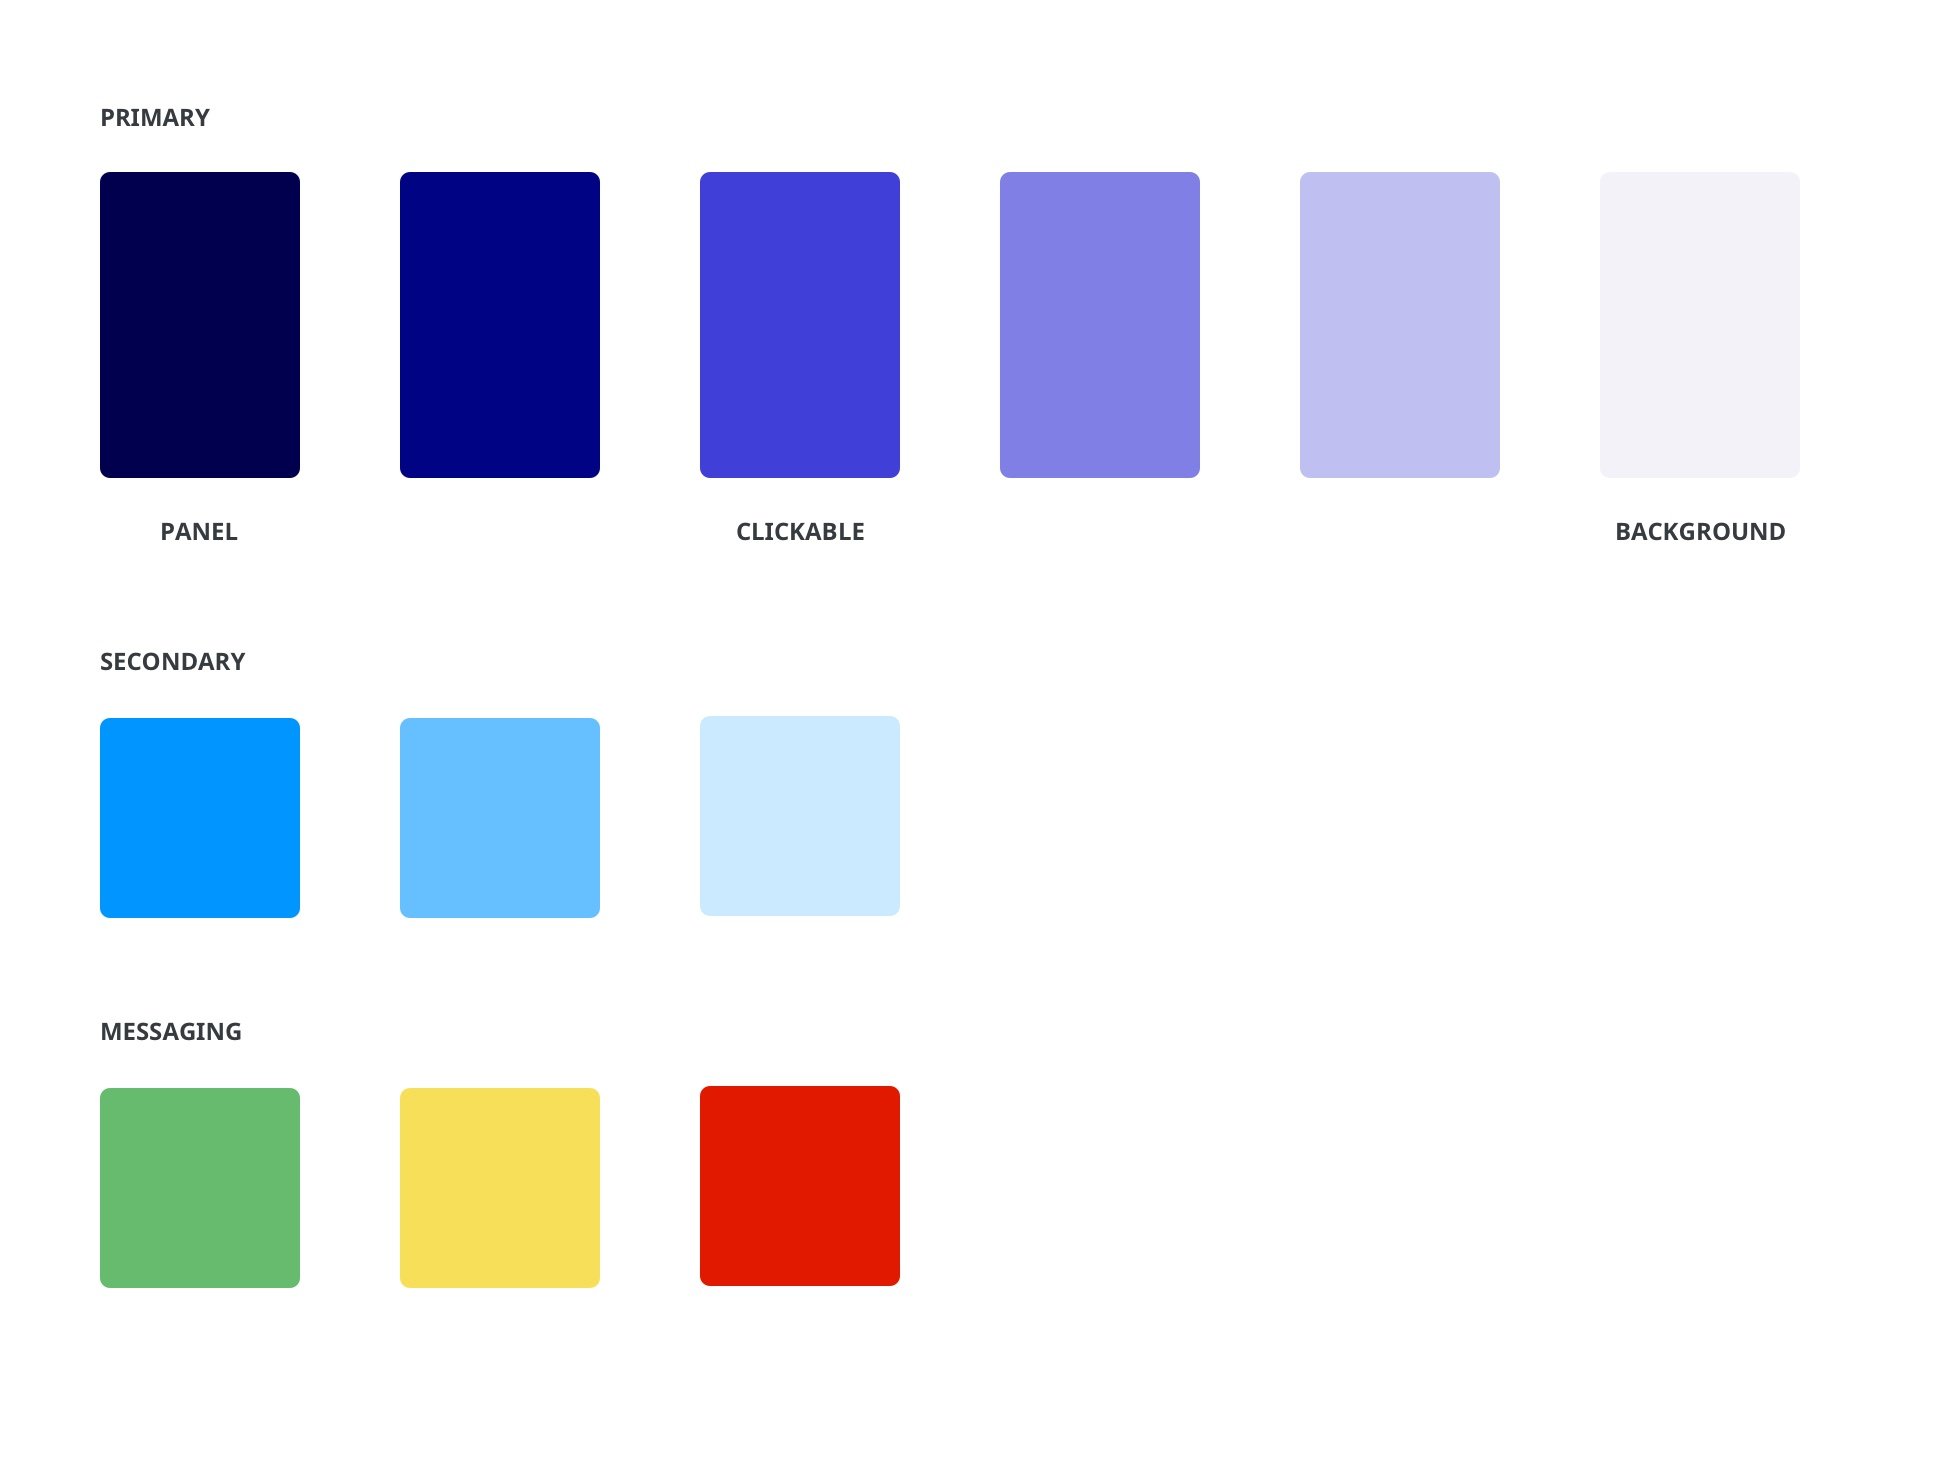
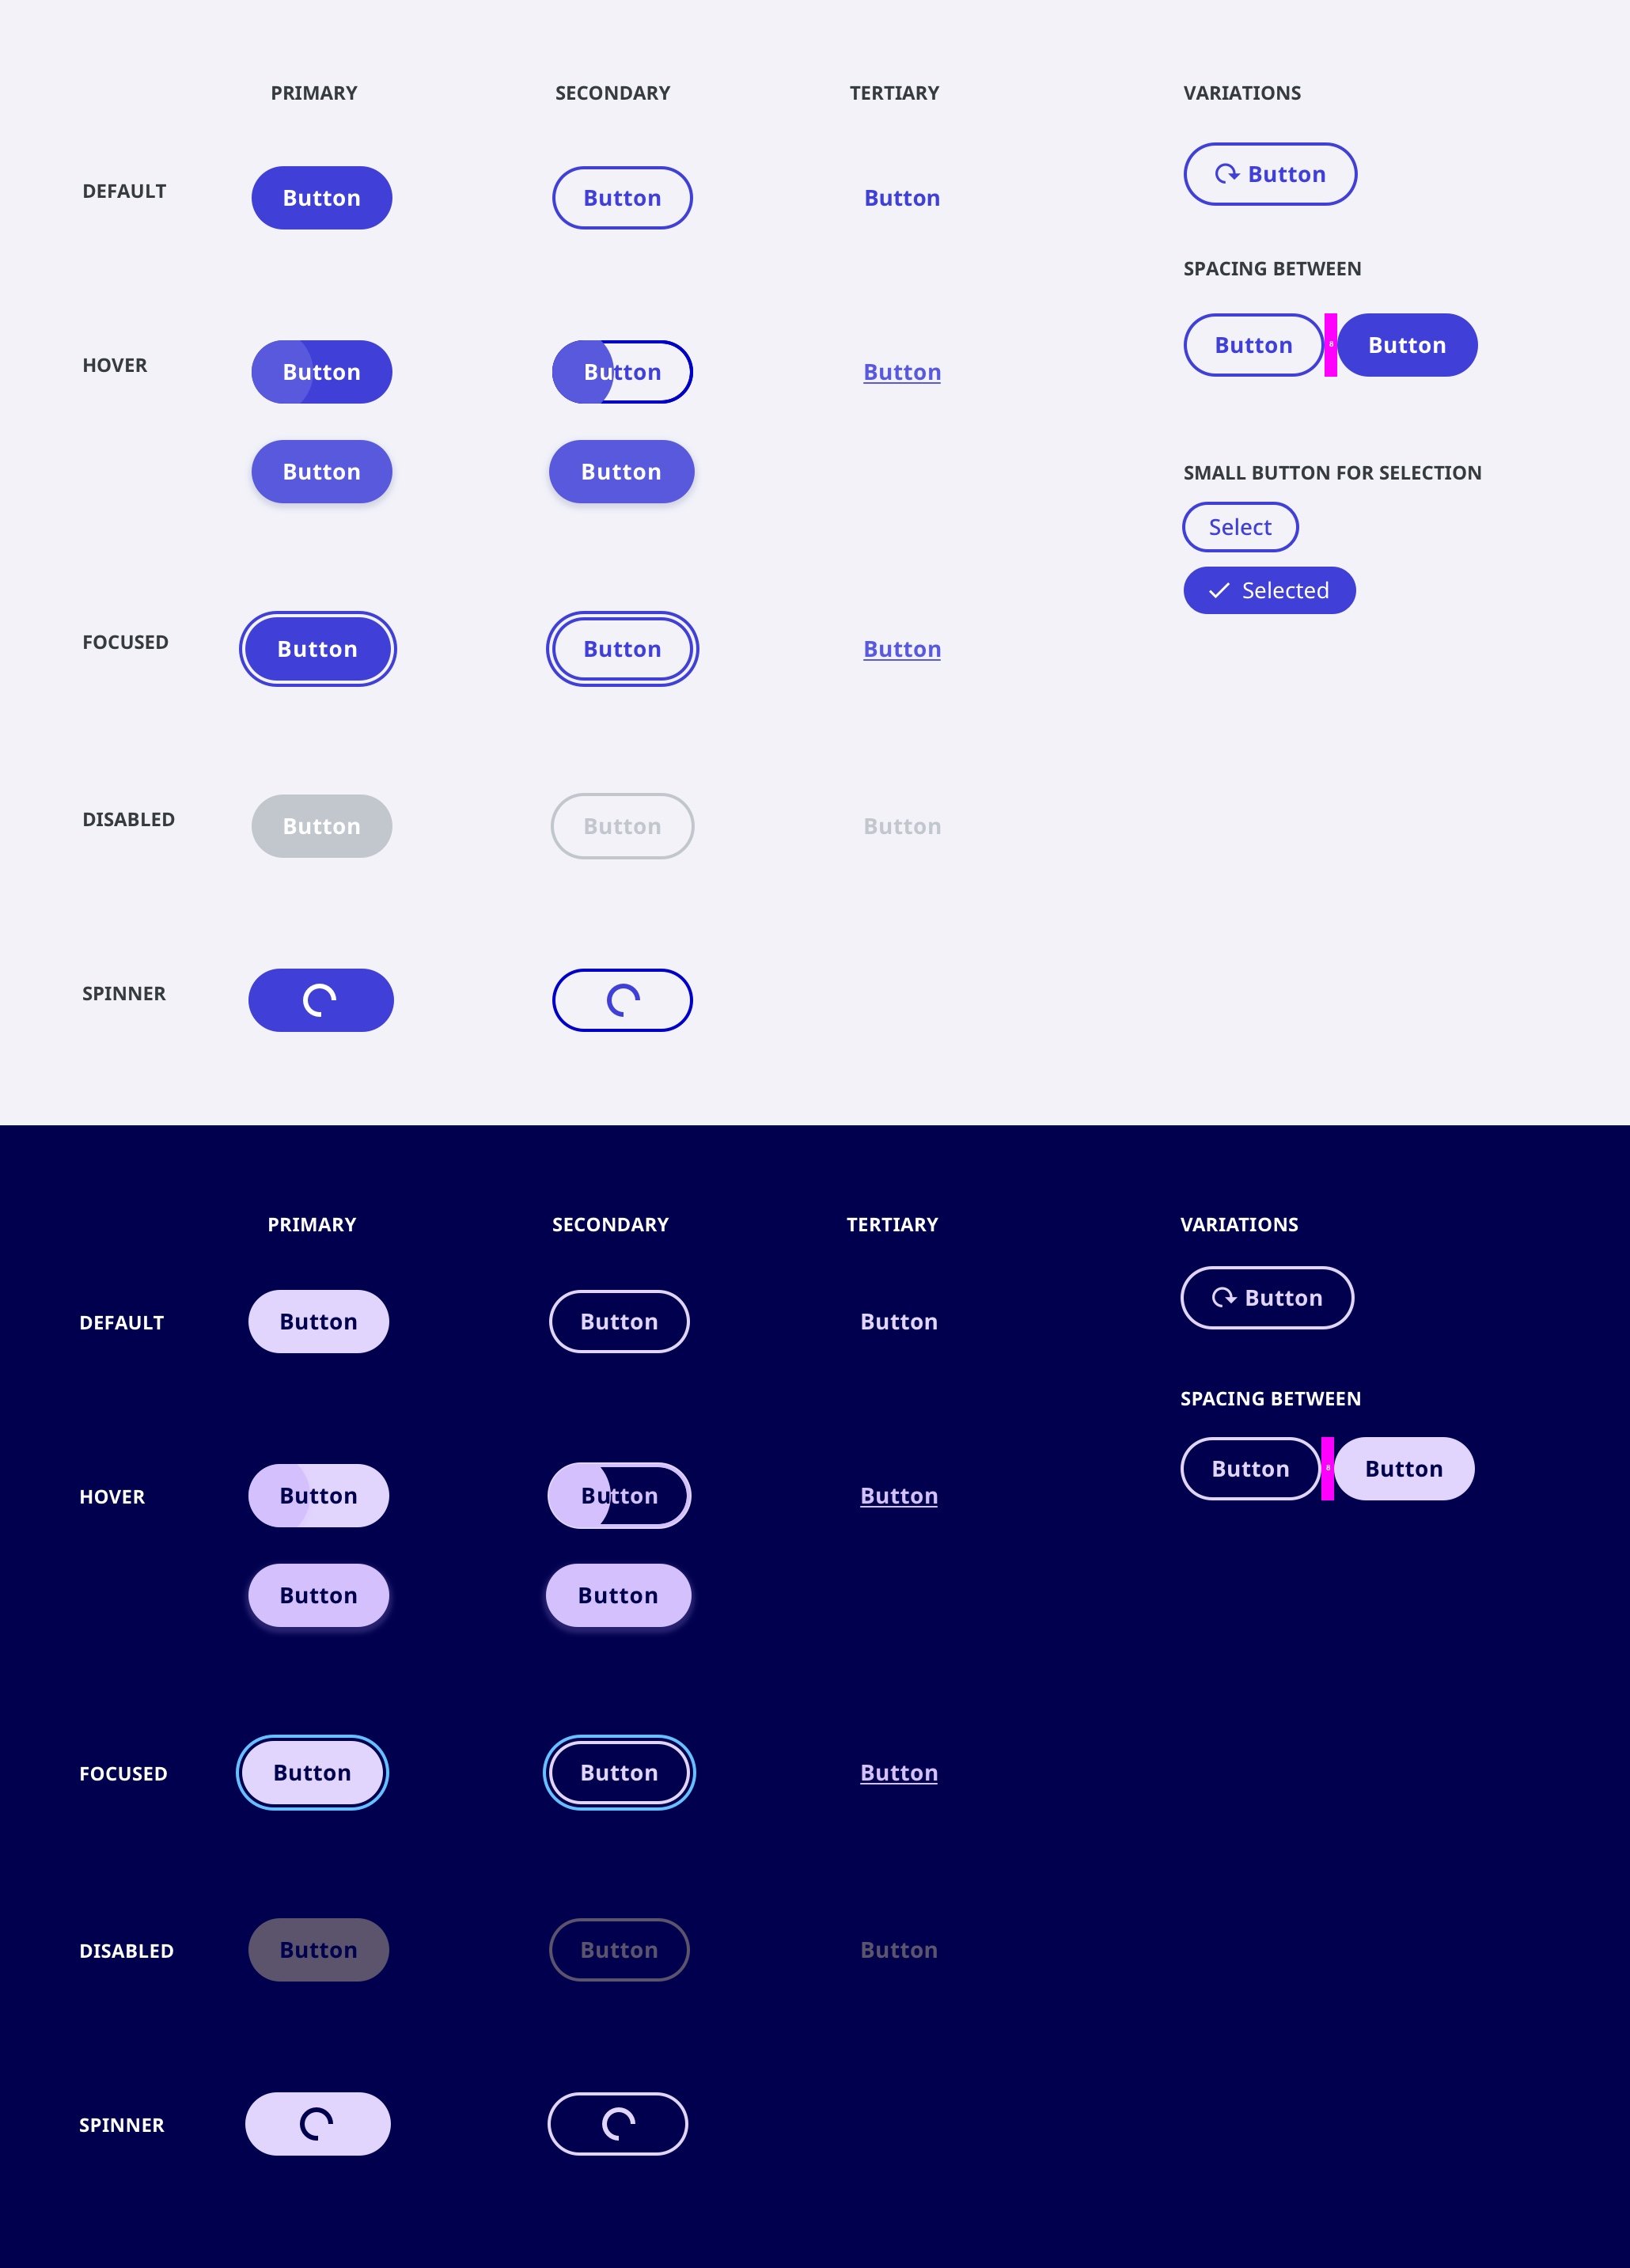
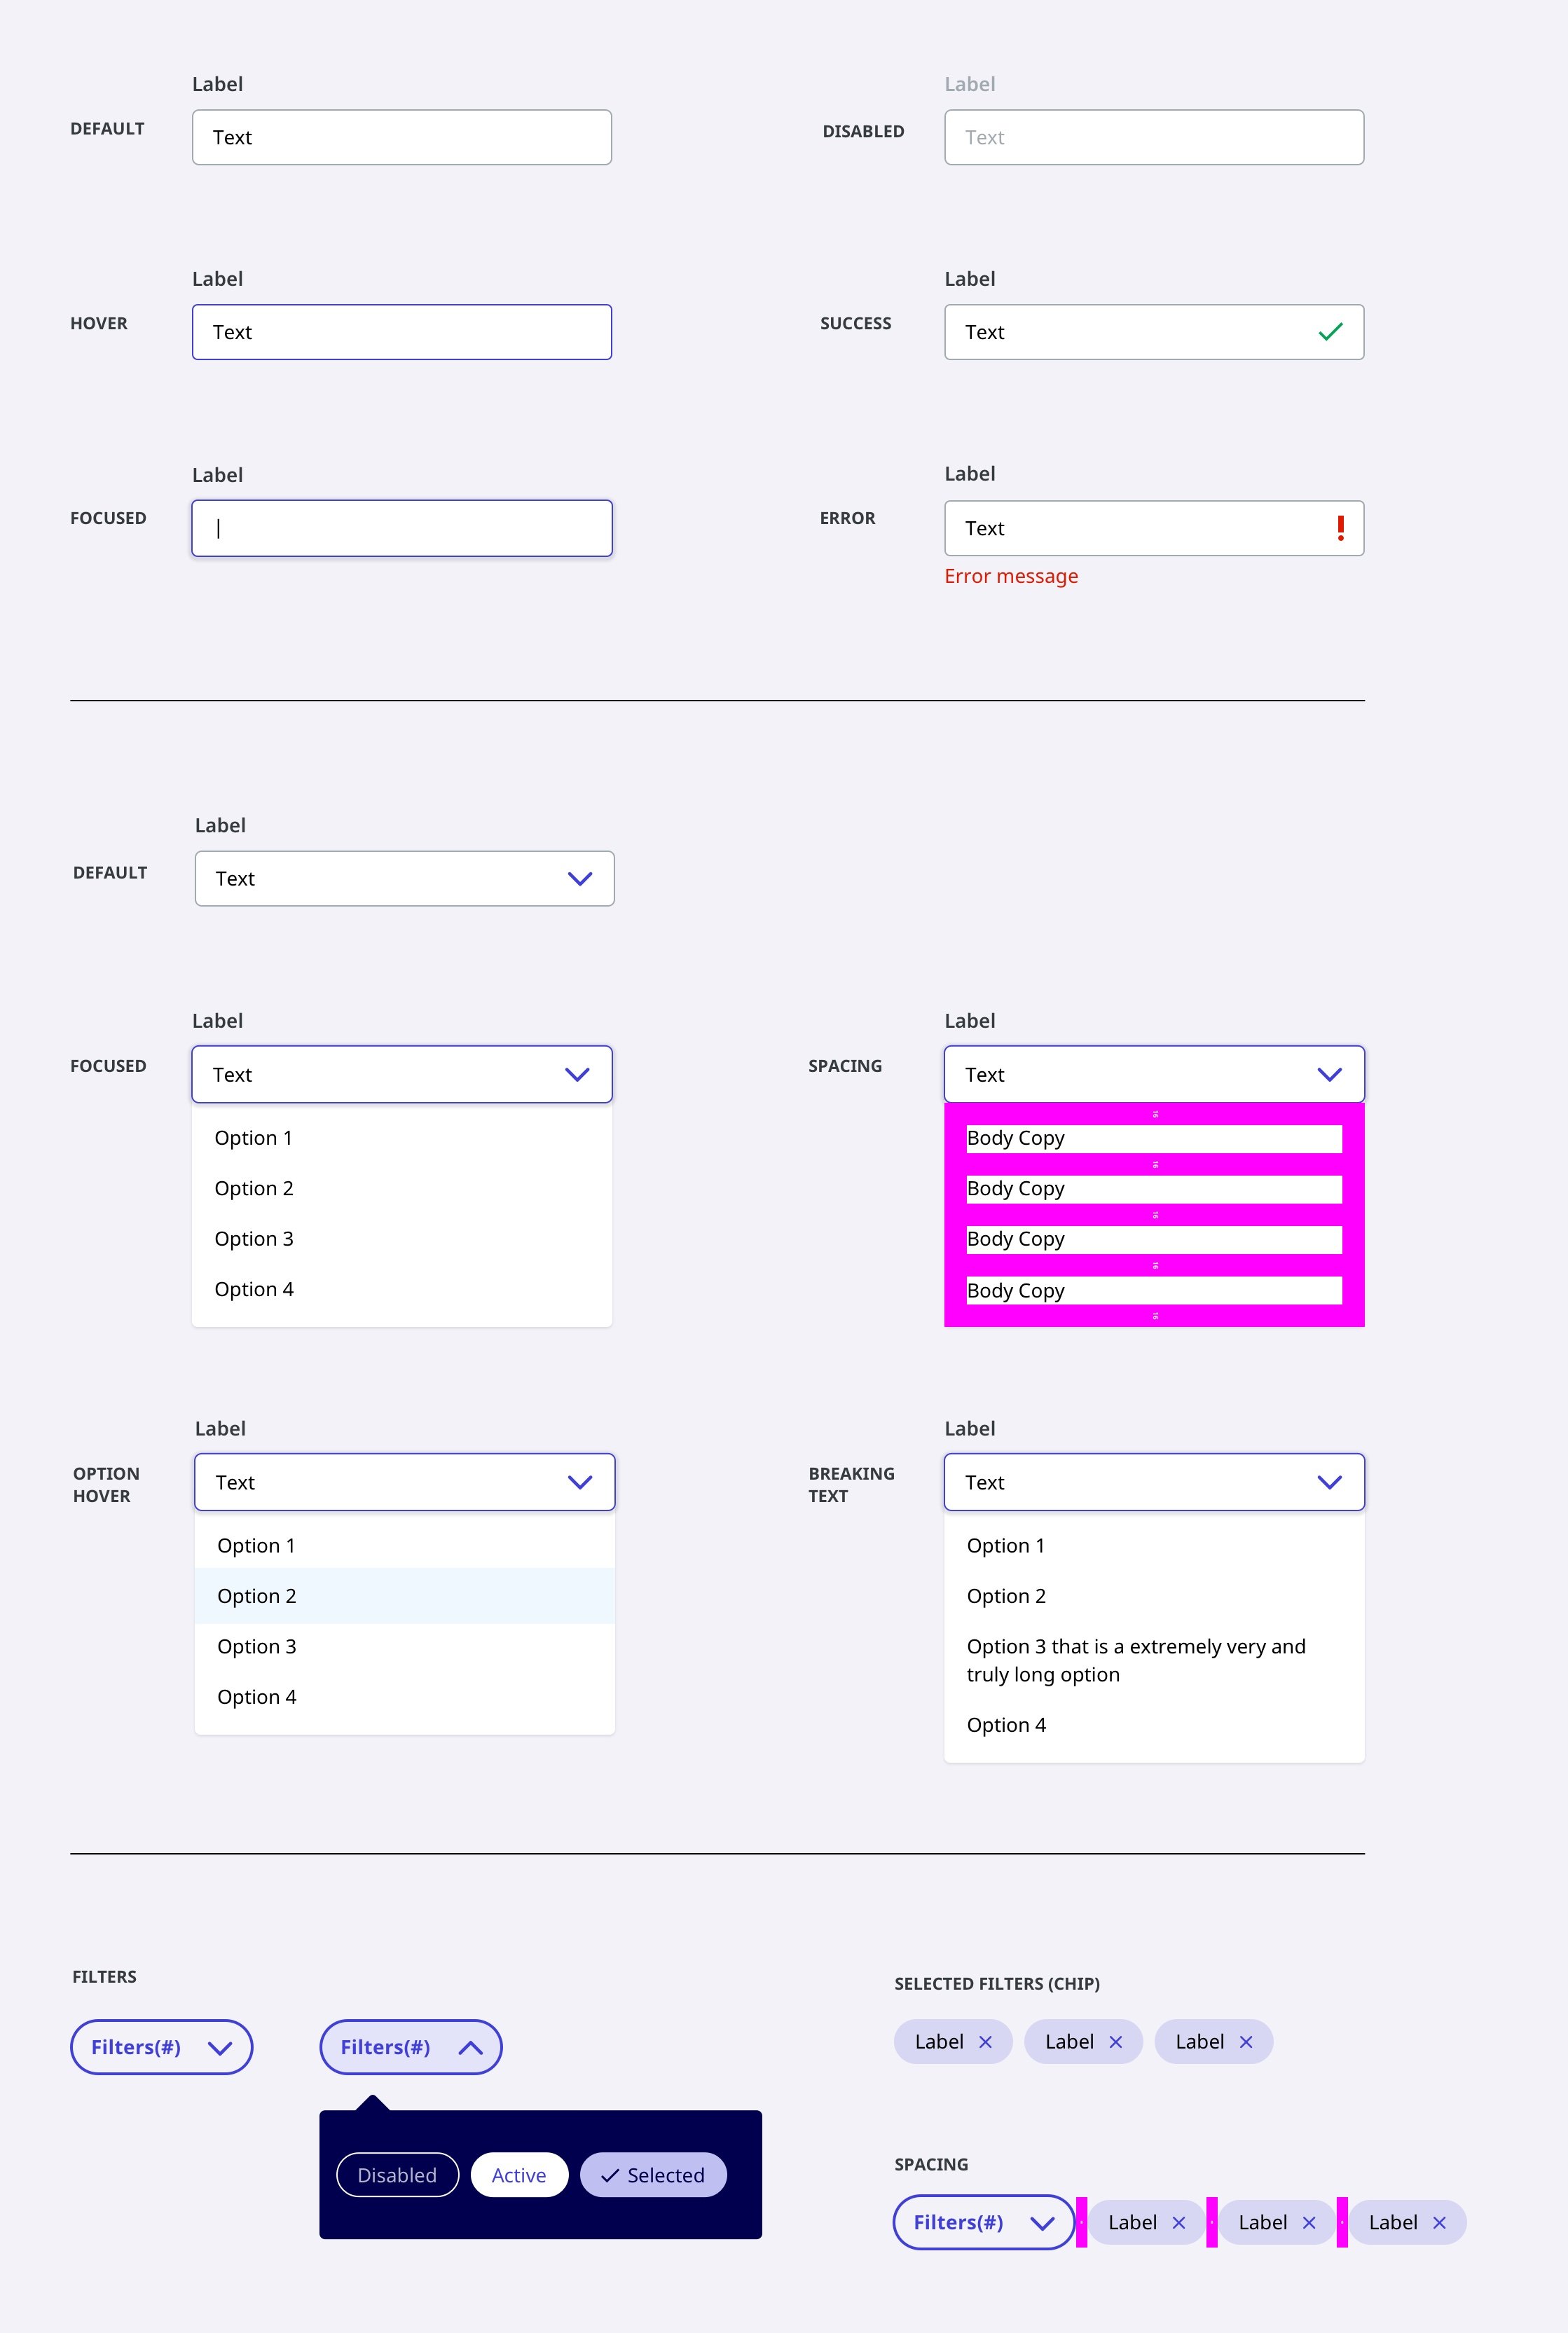
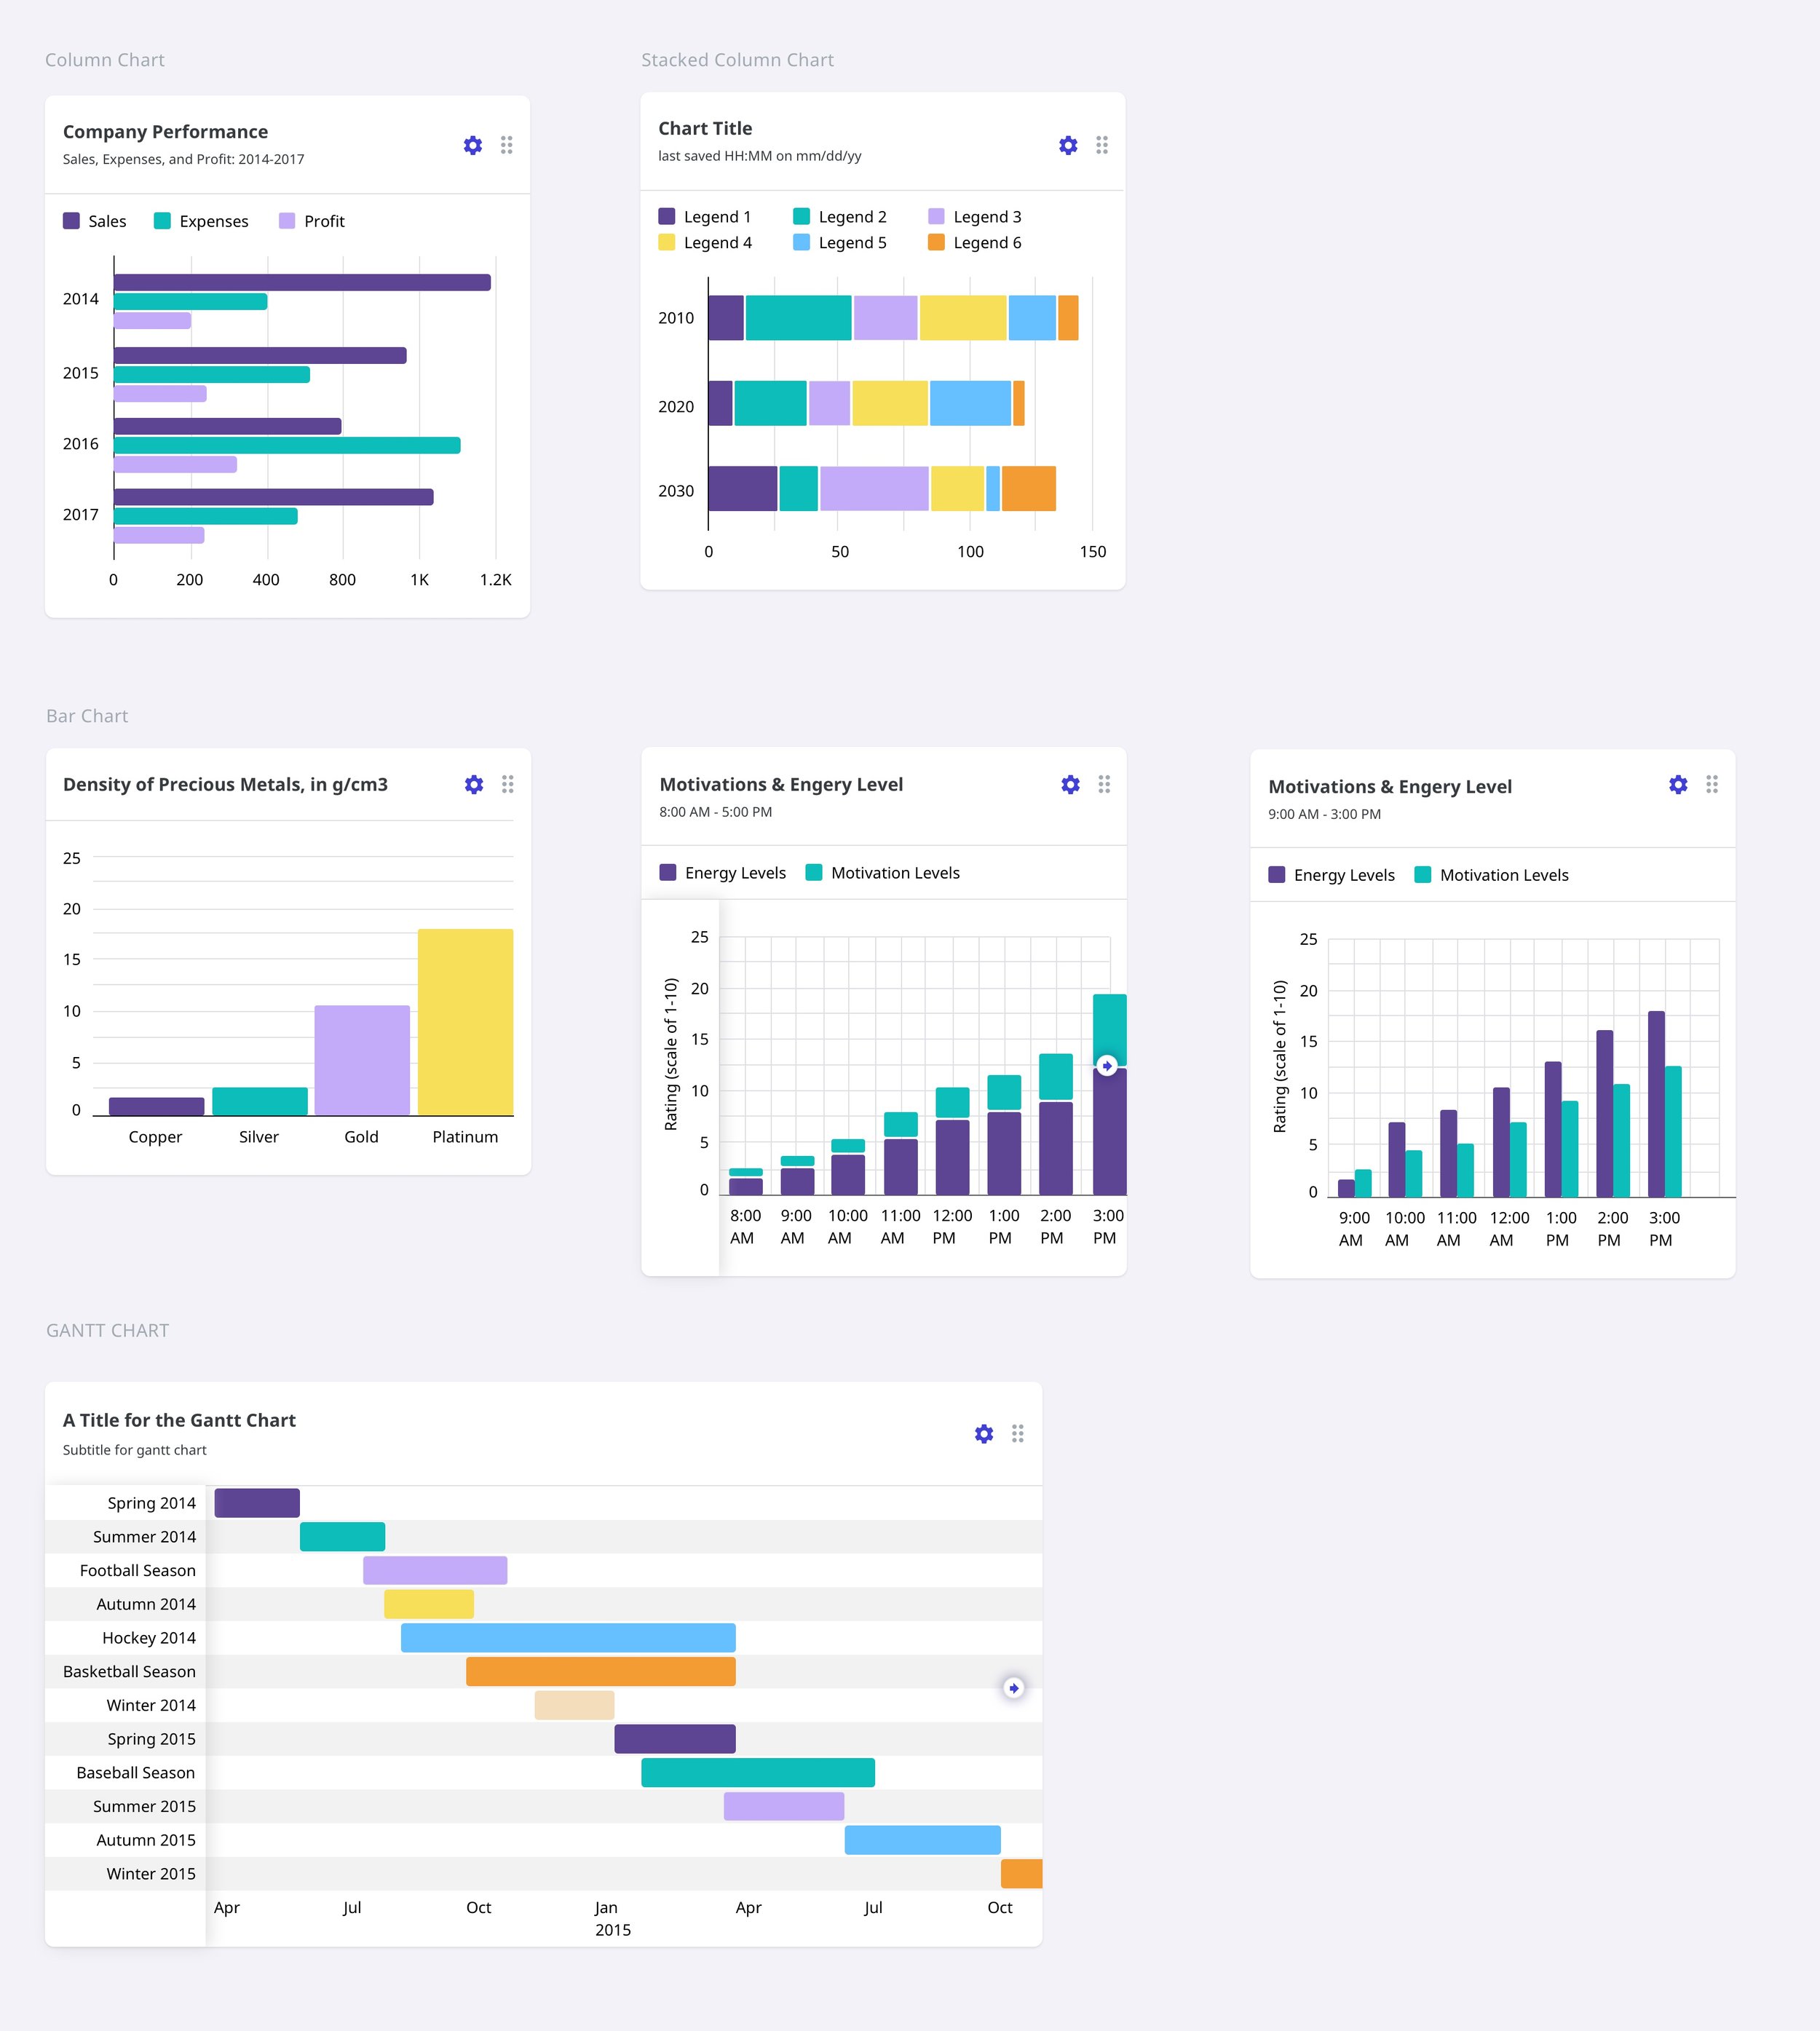
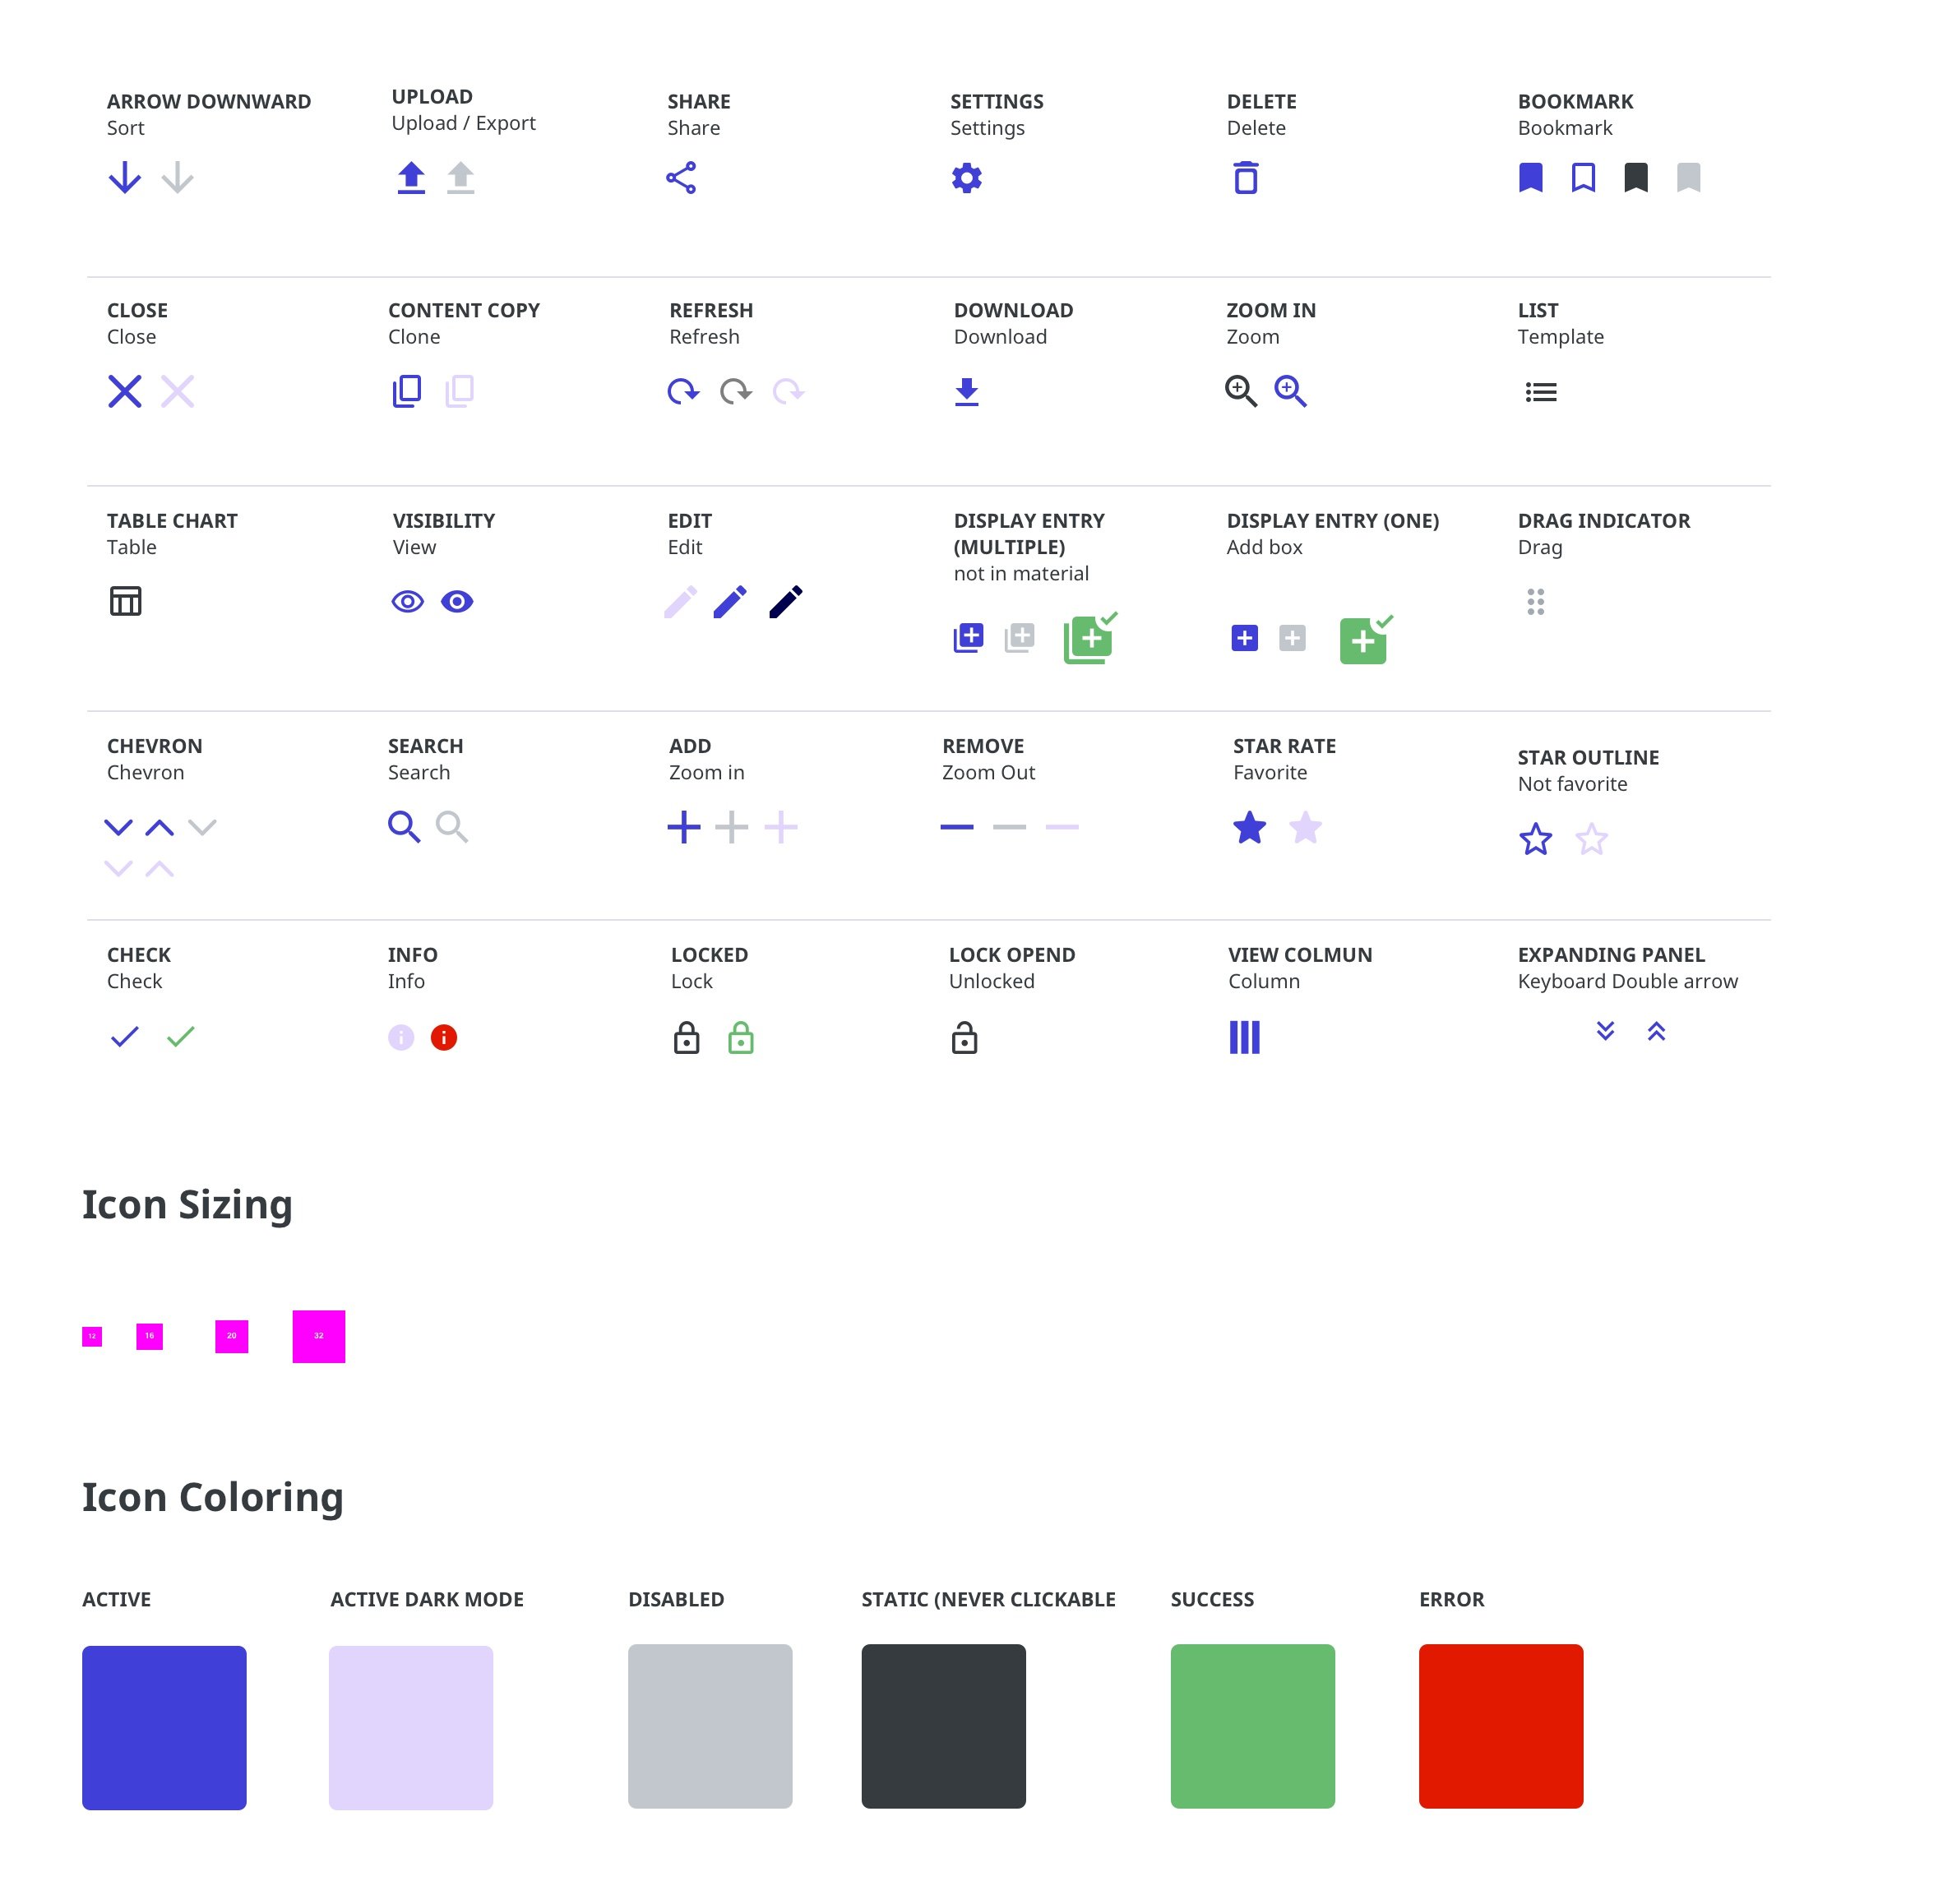
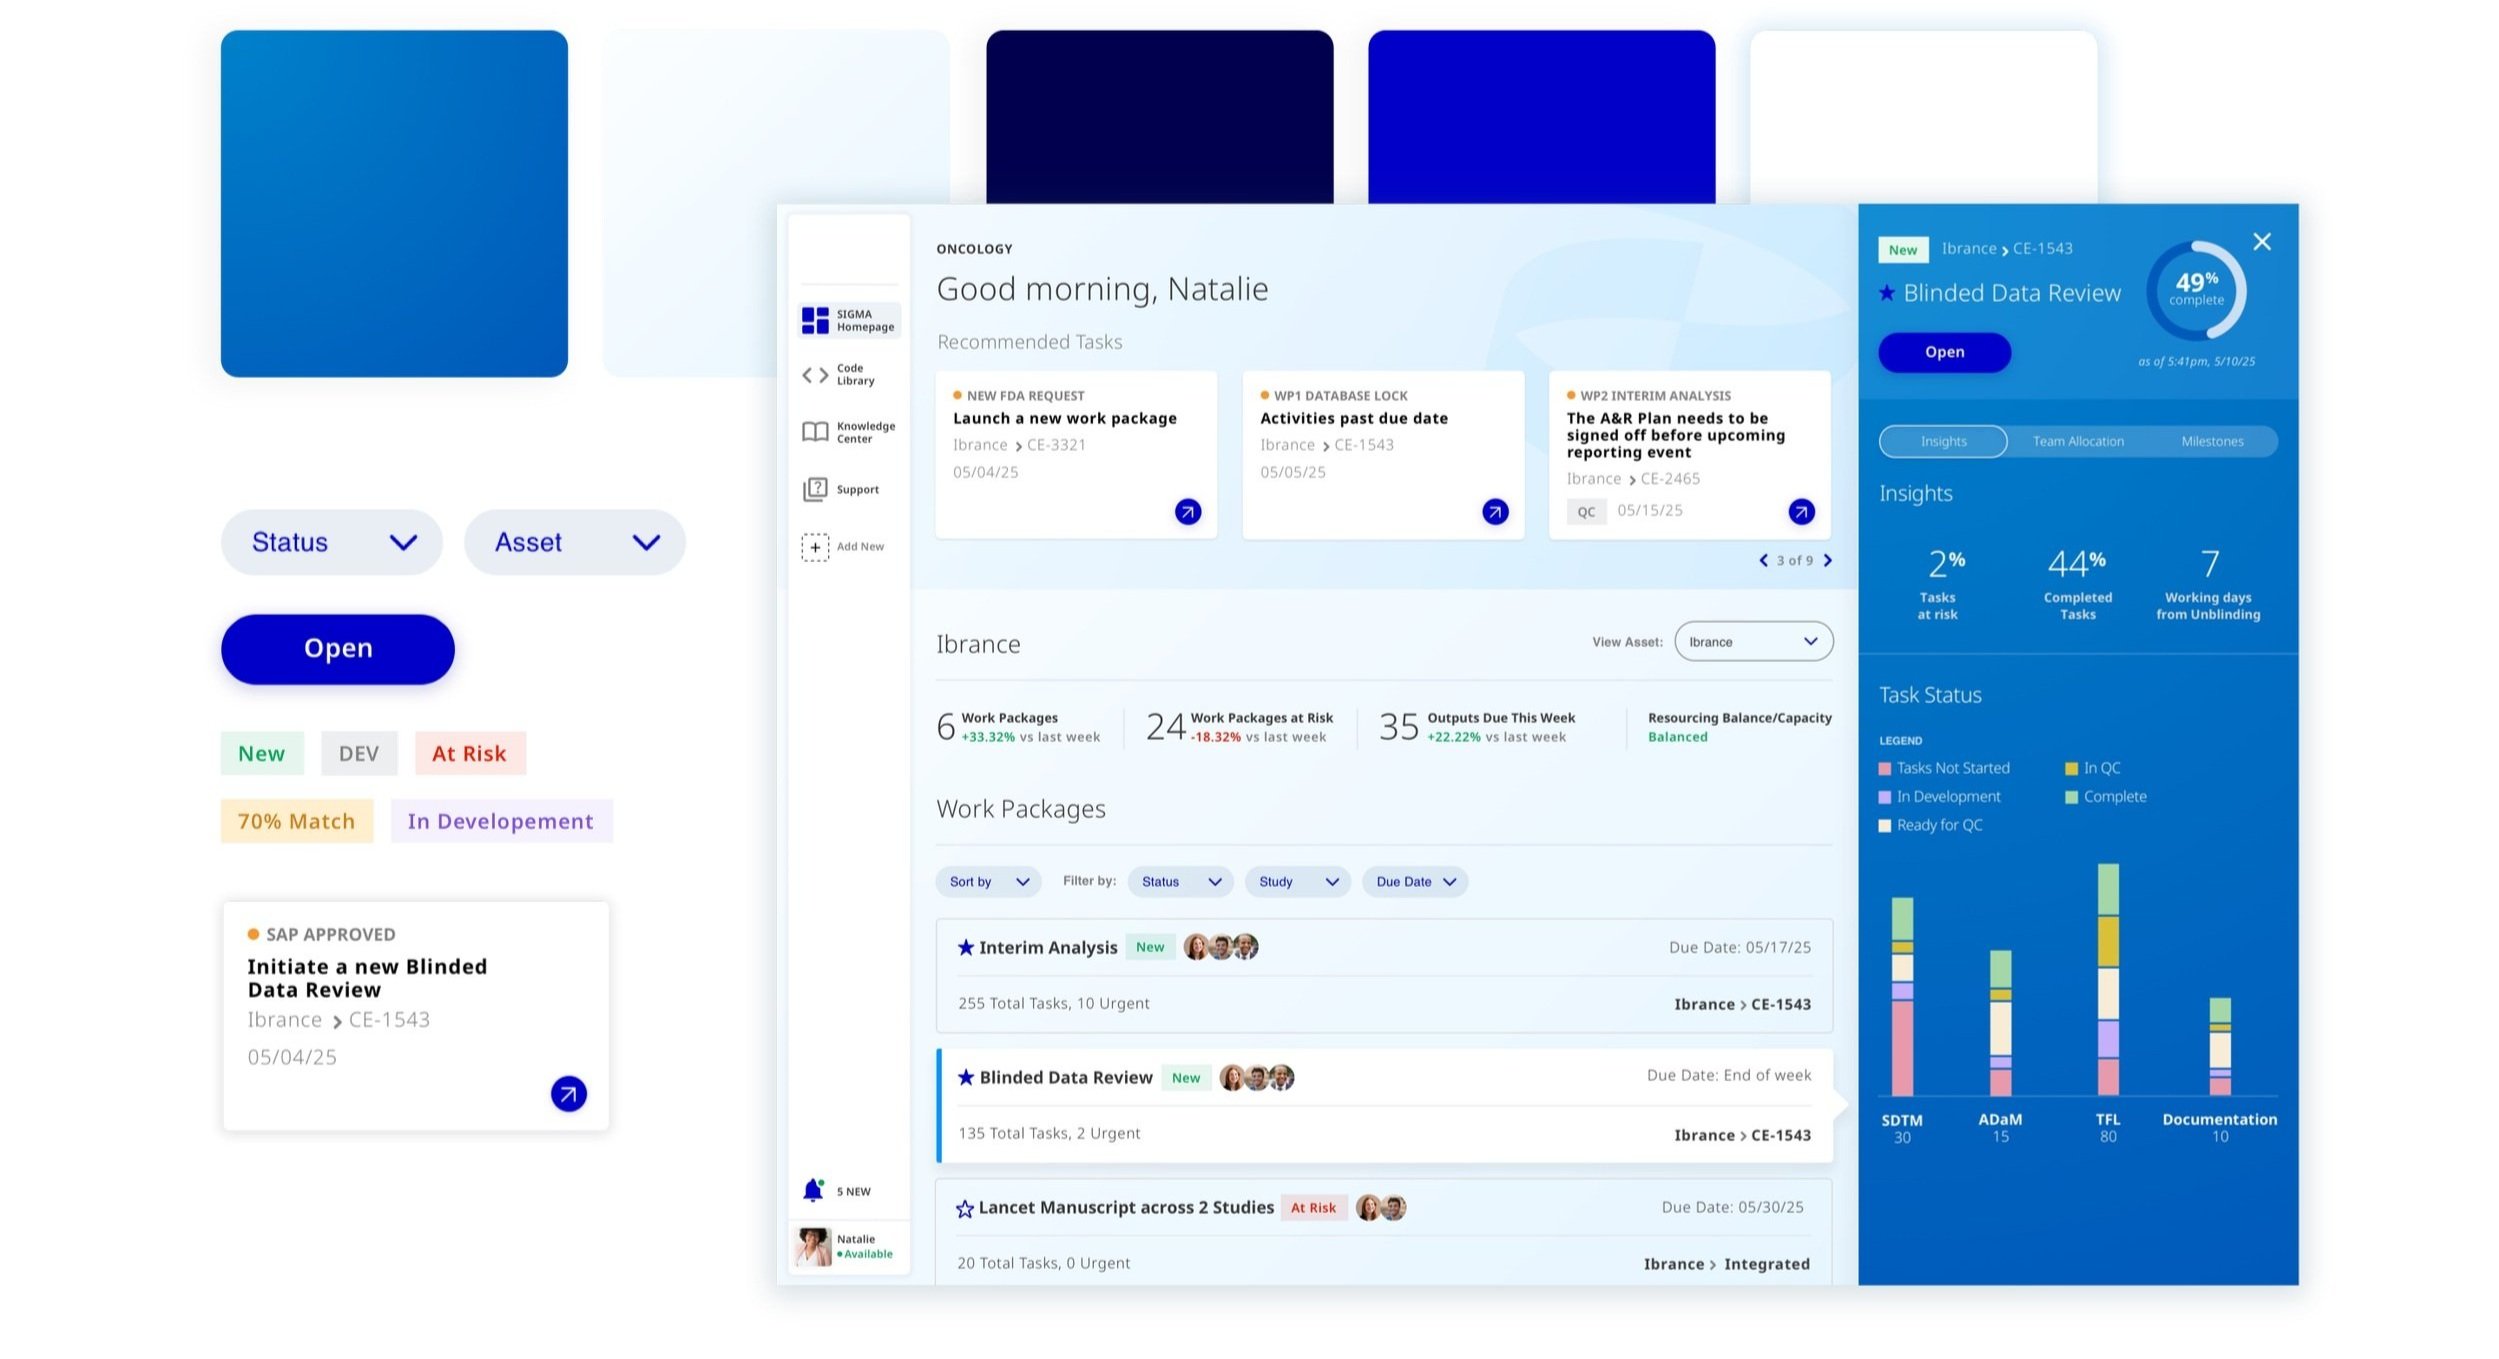
With the brand colors at hand, I built out an comprehensive, ready to build, scalable design system.
